Exceptional earnings: a prerequisite for uptrend?
  • Global equities continued their ascent as All Country World Index reached new all-time high
  • The yield curve in the US flattened further, but historically current levels resulted in positive returns from stocks
  • Despite already very high expectations, 78.6% of all the S&P500 companies have reported earnings that exceed analysts’ expectations
  • Expected Q2 earnings growth rate in Europe is 8.7% and close to 50% of companies that reported so far exceeded expectations
  • Equities are not cheap, but considering the strong earnings growth current valuation levels look reasonable

Global equities continued their ascent as All Country World Index reached new all-time high

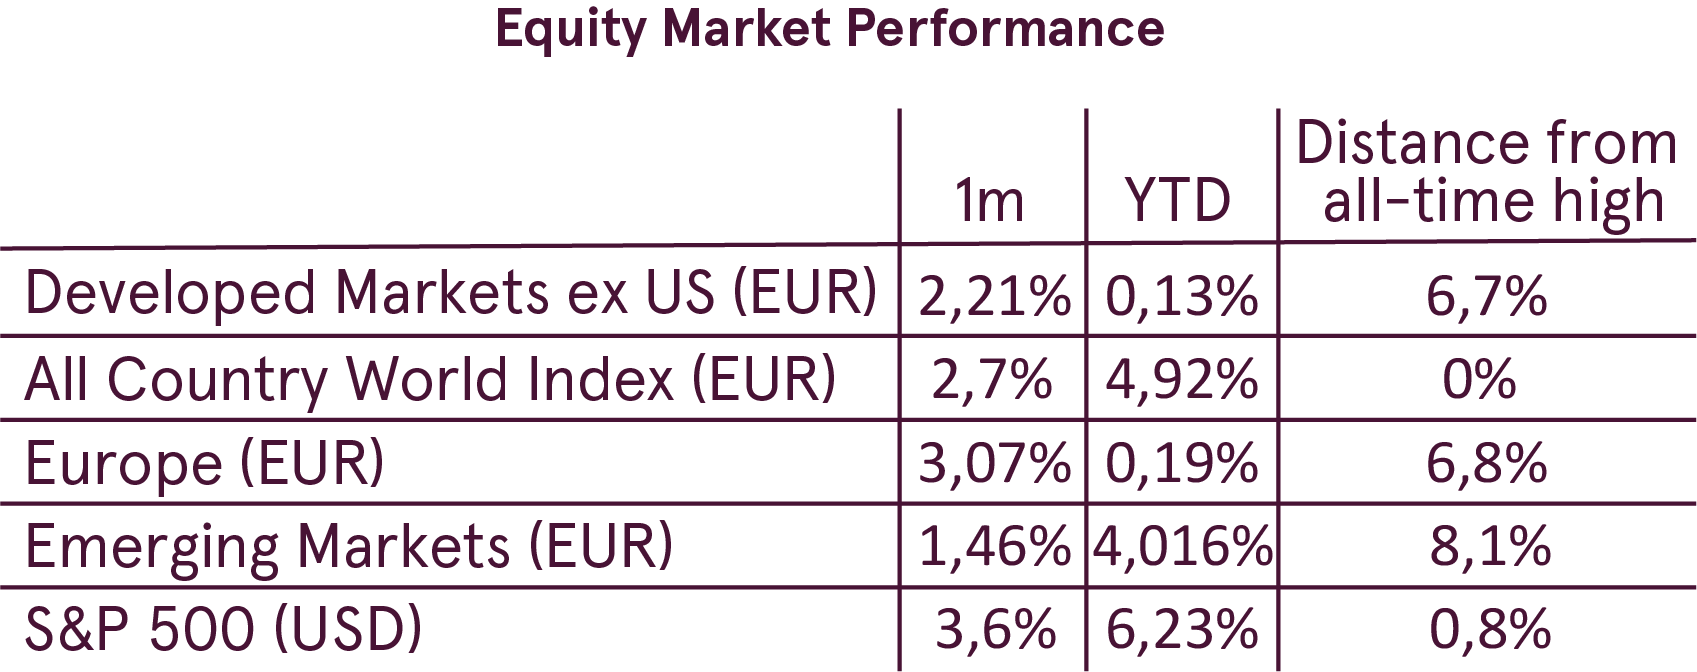
July was a good month for risky assets and global stocks finished the month with a gain, buoyed by very strong earnings season. Risk-on sentiment continued also on the first trading days of August and propelled the All Country World index to new all-time high (in EUR). The index is now up 4.9% year-to-date after an 2.7% increase in July.

US equity market was once again the main driver, supported by fastest earnings growth as the tax cut effects are showing up in the earnings. The S&P 500 rose 3.6% in July and remains less than 1% below its all-time high.

Emerging market equities are still down since the beginning of the year, but managed to gain 1.5% in July, continuing the rebound from the lows.

Bond yields did not experience any big moves rising slightly in both EU and US. In the US the yield curve continued flattening, as 10-year yield is stuck stubbornly below 3%, while the short term yields are rising in a reaction to the Fed tightening.

The yield curve in the US flattened further, but historically current levels resulted in positive returns from stocks

Movements in the yield curve once again came on investors’ radar, as the spread between the 10-year and 2-year yields just dropped below 0.3%.  The reason for such close scrutiny of the yield curve movement is the fact that historically the inversion of the curve, which means that short term rates rise higher than the long term rates, has indicated an upcoming recession with a lead time of about a year.

We have also touched this topic in our May issue of the market overview, where we noted that the curve is still quite far from being inverted and historically the stock market returns were positive in 1 and 3 years following similar levels of the yield curve. Analysis shows that also the decline to the current levels of the yield curve were historically followed by positive S&P 500 returns. Since the year 1976 when the 10-2 year yield spread moved below 0.3% the S&P 500 returned 16.3% and 47.9% on average during the following 1 and 3 years respectively. This is significantly better than the average 1 and 3 year returns for this period of 9.2% and 30.6% respectively.

Moreover, there is additional evidence that can support the argument that this time even the full inversion of the yield curve may not actually signal any trouble ahead.

First, in addition to the yield curve it is important to also take into account the current level of the interest rates and inflation. Recessions are usually caused by the credit crunch that happens when Central bank raises rates aggressively to too high levels trying to combat the excessive inflation and overheating economy. Since the year 1976 when the US yield curve inverted, 2-year yield was 8% and inflation 5.1% on average. Currently 2-year yield is below 2.7%, while core inflation is around 2.3%. As there is no significant inflation pressure now the Fed is not in a rush to raise rates and does so gradually, taking into account the current macro data.


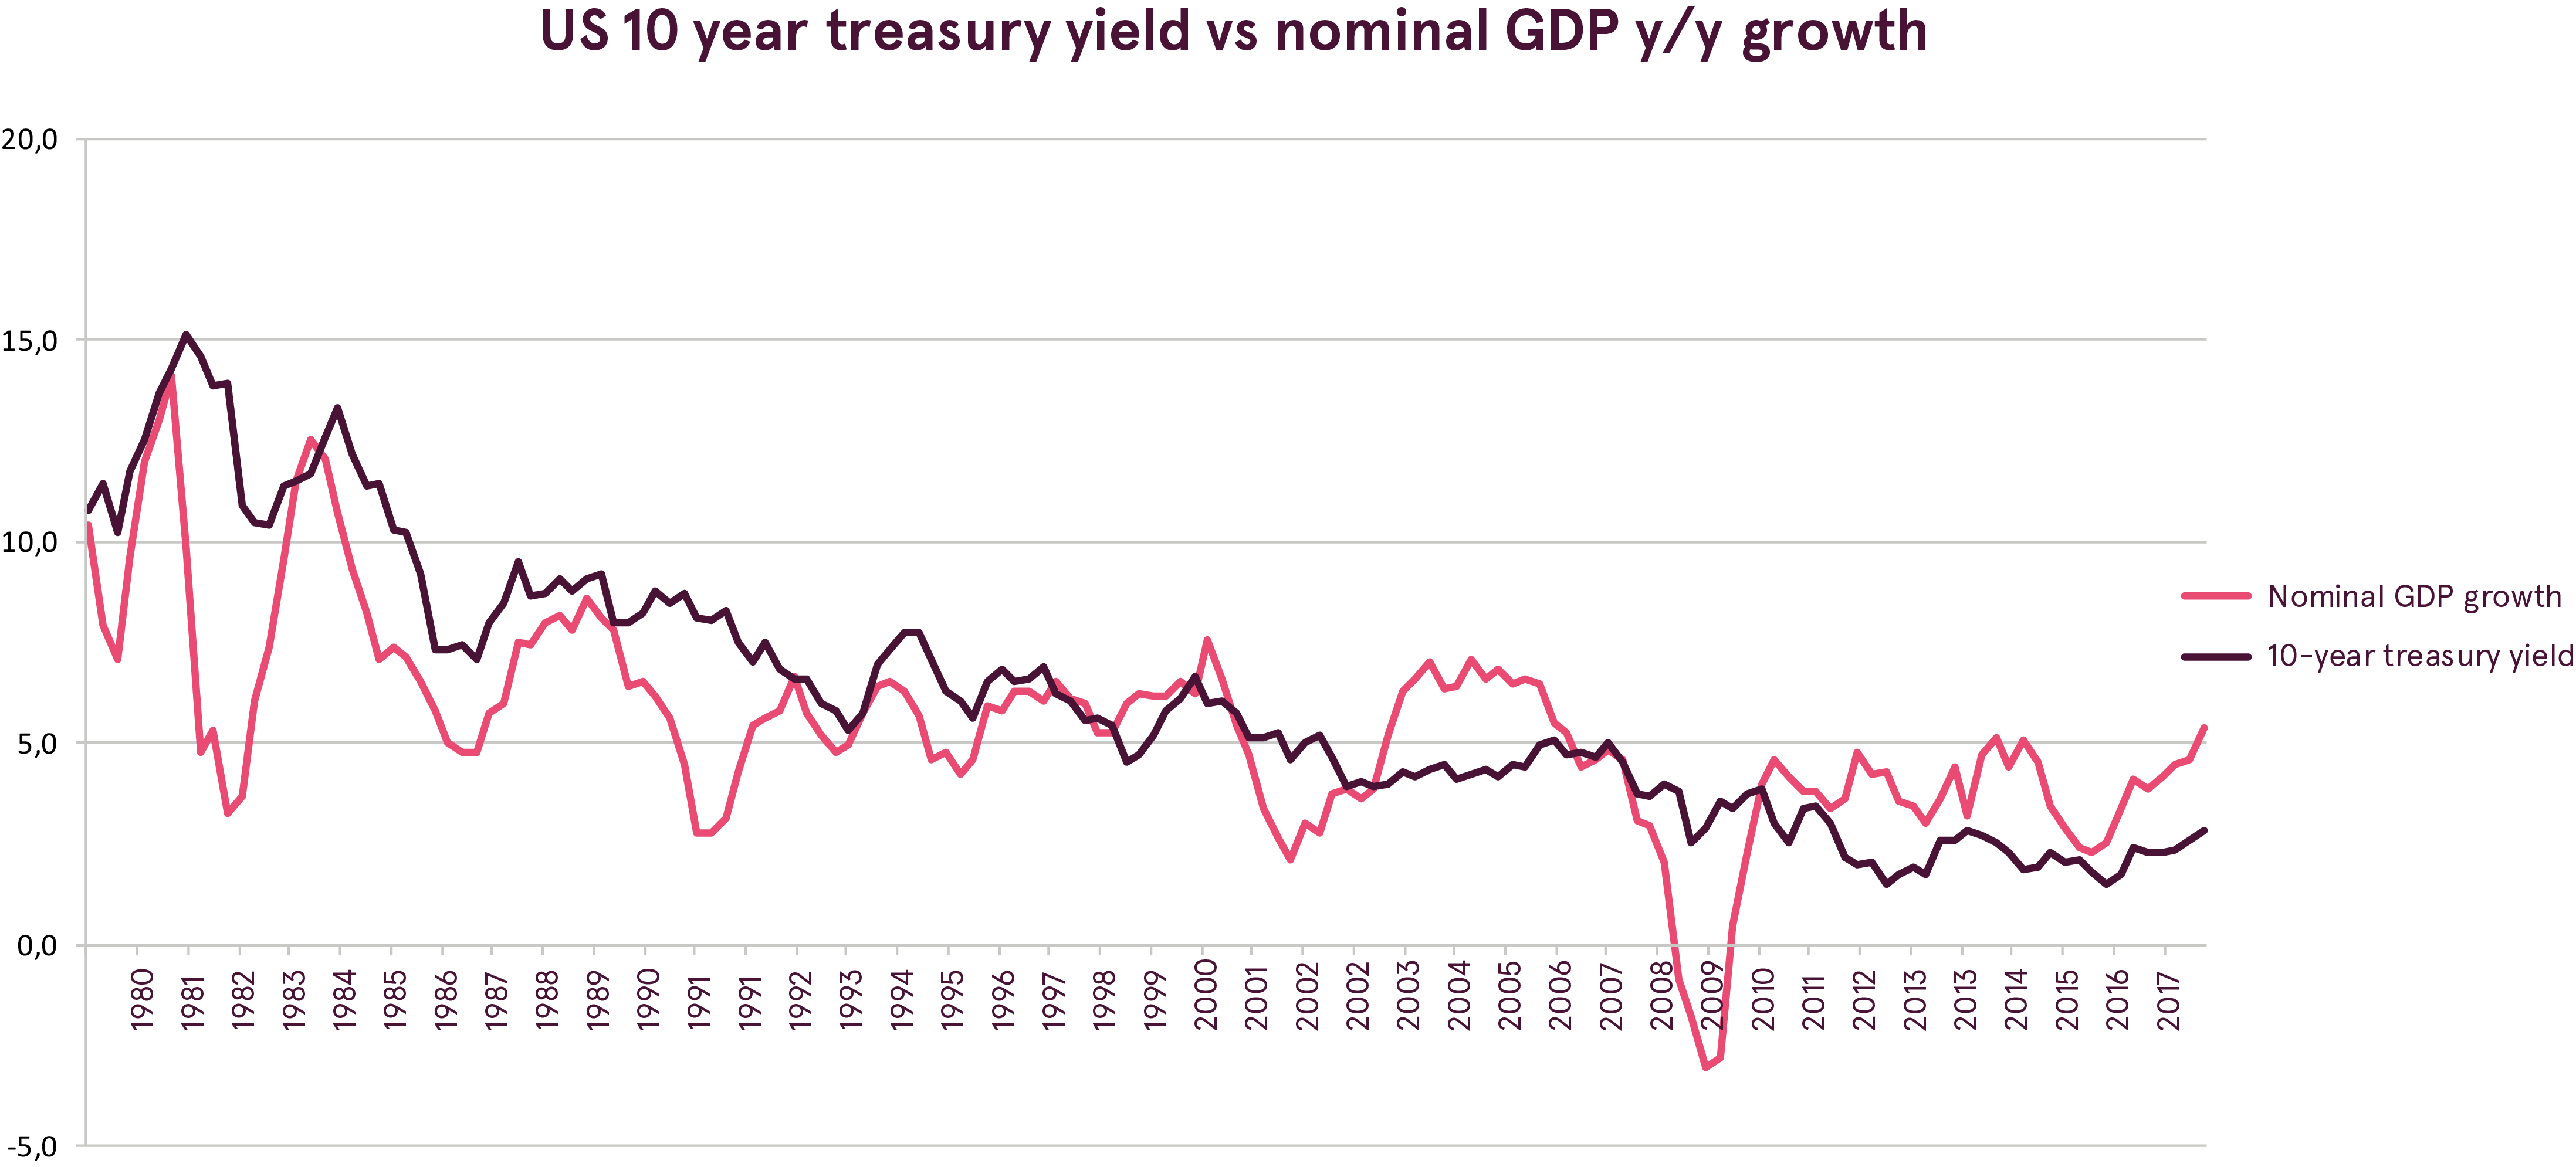
Secondly, globalization of the bond markets and the negative interest rate policies of the ECB and the Bank of Japan (BOJ) may be distorting the US 10-year yield contributing to the flattening of the yield curve. Both the ECB and the BOJ lowered their official rates to below 0, which dragged also the 10-year yields in EU and Japan to close to zero. As a result, more investors are choosing the US bonds looking for better yield. And taking into account a large amount of wealth that was created since the year of 2009, a big part of which is still being allocated to safe bonds, those flows can easily push down US 10-year yield. Supporting that argument is the following interesting observation. As the history has shown, 10-year Treasury yield tends to trade around the year over year growth rate of the nominal GDP. However since the mid-2010 it has consistently been below nominal GDP growth. And now that spread is close to the widest since then, as the nominal GDP was growing 5.4%, while the bond yield is around 3%.

Q2 earnings season is exceeding expectations and future guidance is also strong

The Q2 2018 earnings season is turning out exceptionally strong, especially in the US. Despite already very high expectations, 78.6% of all the S&P500 companies have reported earnings that exceed analysts’ expectations. The latest data shows that the second quarter surged 23.5% from Q2 2017 in the US. Importantly, also the revenues are growing a healthy 9.2%, confirming that the earnings growth is not only due to the effect of the tax reform.

In comparison with the US, European Q2 corporate earnings are more moderate, but the growth is still robust. The expected Q2 earnings growth rate in Europe is 8.7% and close to 50% of companies that reported so far exceeded expectations.

For investors, however, forward earnings are the most important, as they are the main driver of the stock market. And current estimates and forward guidance support continuation of the uptrend. Cheaper euro should help improve European earnings, which are expected to reach double-digit growth during the next year.

In the US, as the effect of the tax cuts disappears, earnings growth will naturally slow down from the current levels. However, the market still expects earnings growth to continue running above 10%.

Equities are not cheap, but considering the strong earnings growth current valuation levels look reasonable

Current equity valuation is often voiced as a concern by investors, as many consider equities to be expensive. Although definitely not cheap, the extent of expensiveness depends on the measures used.
Although the growth in earnings has helped improve the picture, the trailing P/E ratios (using the past earnings) are well above historic averages. The Cyclically Adjusted P/E ratio for the All Country world index is currently at 21.8, compared to a median of 18.4. Emerging market equities are cheaper at 14.1, but are still not too cheap and are close to the long term median of 15.9.


Yet as the stock market is discounting the future expectations, the forward PE (price divided by the 12-month forward expected earnings) should provide a better gauge of the current valuation. Looking at the forward PE, the picture is much better and equities look more fairly priced. The forward PE for the US is now at 17.1, All Country World index has a forward PE of 15, while Emerging market equities trade at just 11.4 forward PE.

Outlook

Summing up, the current environment continues to be supportive for risky assets. Global economy is growing at a healthy pace. The lack of inflation pressures allows for the central banks to keep global monetary policy at the accommodative stance and the tightening process is very gradual.
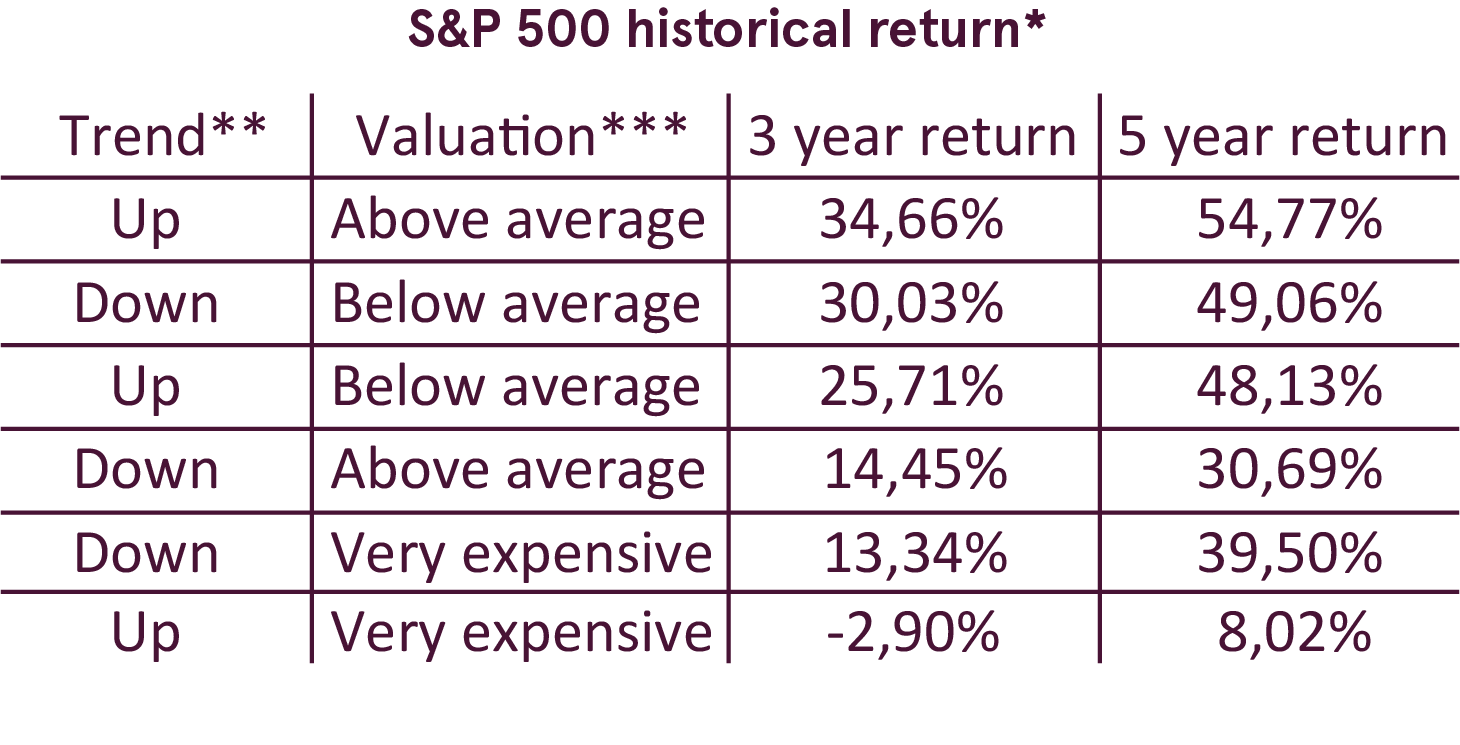
Equity valuation should not be a big concern to investors, as historically equities have provided good returns in 3 and 5 year perspective in the similar situation to the current - when they were in the uptrend (above 10-month moving average) and above average valuation. Only when the valuation gets extreme (more than 1 standard deviation above average) does return outlook deteriorate significantly, but we are far from those levels.


The main risk to our outlook is the possible escalation of the trade wars and the resulting impact on the economy and earnings. However, it is really impossible to predict actions of the politicians and thus how it will all play out. Therefore we follow closely the developments in this area, taking into account that volatility may be increased as events unfold.

DISCLAIMER

The present marketing material (Overview) was prepared by Luminor Bank AS (Luminor) analysts based on publicly available information at the time of preparation and relying on their professional evaluation.
Subject to changes in circumstances, the opinions given in the Overview may differ from current ones, which is why Luminor bears no responsibility for the timeliness of the opinions presented in the Overview.
This Overview should not be deemed an investment consultation or an offer to invest in financial instruments, make financial transactions or act in any other way. The Overview may not be interpreted as Luminor’s confirmation or promise of occurrence of the events reported in the Overview. The data presented is not connected to any potential information receiver’s specific investment goal, financial situation nor any specific needs.
The historical yield of securities described in this Overview is for reference only. The historical yield may not be considered as a guarantee for future investment results, as the real yield may differ considerably from the one referred to herein.
Luminor shall not be held liable for any loss that the customer might incur due to relying on information contained herein. Before making any investment or credit decision it is recommended to use the help of a respected professional and evaluate the suitability of the investment product or service to the customer’s risk profile and goals.
The terms and conditions of financial instruments and investment fund prospectuses can be found on the Luminor homepage www.luminor.lv. This material may not be copied, distributed or published in any form without Luminor’s prior written consent.