
2018 Q4 earnings season brings back investor optimism
- Best start of the year for global stocks since 1987
- Global corporate earnings are expected to grow 7% in the year ahead
- The IMF has cut its global growth forecast cut to 3.5% for 2019
- In Q4 last year investors have pulled the record amount of money out of financial assets since the financial crisis of 2008
- The Fed has paused its rate hiking cycle and pledged to be patient
Best start of the year for stocks since 1987
After the worst month in 6 years and the hardest year for investors since the financial crisis new year started in sharp contrast. January 2019 was the best first month of the year for global stocks since 1987. The rally erased most of the December losses as investors gained confidence. The All Country World index rose an impressive 7.4% in one month and is currently just 5% below its all-time high level.
Historically, looking the at MSCI World index, there were only 3 more case when stocks rose more than 7% in January. Interestingly, the market ended the year positively in all three of those cases with an average gain of 17.9%. However, one has to be careful interpreting such statistics, as there is no economic dependency between the first month and the rest of the year and it may just have been a pure coincidence, which may not repeat.
Emerging market equities continued outperforming driven by remarkable gains from Latin American region. The equity market there surged 14.5% in January supported by cheap valuations. Overall, the Emerging market index gained 8.3% last month. Also the European equities, which were lagging last year, posted a gain of 6.1% in January.
Equity Market Performance
| 1m | 2018 | Distance from all-time high |
|
|---|---|---|---|
| Developed Markets ex US (EUR) | 6,1% | -11,9% | 12,9% |
| All Country World Index (EUR) | 7,4% | -6,7% | 5,2% |
| Europe (EUR) | 6,1% | -13,1% | 13,9% |
| Emerging Markets (EUR) | 8,3% | -6,4% | 2,9% |
| S&P 500 (USD) | 7,9% | -6,2% | 7,2% |
* - based on monthly data
Source: MSCI, finance.yahoo.com
Not only equities benefitted from the improved investor sentiment. Also the commodity price index rose over 5%. At the same time credit spreads for both investment grade and high yield bonds decreased, pushing bond prices higher.
What triggered the reversal in investor sentiment?
One of the reasons for the year-end sell-off was the deterioration of forward-looking economic indicators, which triggered a revision of the corporate earnings growth expectation. As a result, expectations were revised significantly lower and amplified the selling pressure.
The Q4 corporate earnings reporting season that started in January was thus especially closely watched by investors for the signs of weakness. However, it turned out that investor expectations got too pessimistic and the actual results were handsomely beating expectations.
Consequently, investors rushed to buy oversold stocks of companies that reported better than expected earnings. This has provided a boost to investor sentiment and helped push equity prices significantly higher.
US corporate profits continue to show strongest growth of all other regions. Over half of all the companies has already reported and from those over 71% beat the earnings expectations. Overall US Q4 2018 earnings are expected to grow 16.8% compared to Q4 2017, which would be the fifth straight quarter of double-digit growth.
Looking forward however, more companies are issuing negative forward guidance than usual and earnings expectations have come down quite significantly. Still, US corporate earnings are expected to grow 7% in the year ahead.
As expected, the corporate earnings situation in Europe is worse due to struggling economy. Of all the companies that reported earnings to date only around 45% were beating analyst expectations. Moreover, the expected overall growth is just a meagre 2.3%. And although analysts currently expect European corporate earnings to grow around 9% during next year, this seems too optimistic. So there is a risk that slow economic growth and political uncertainties result in lower than expected earnings in Europe going forward.
Overall, the picture with the global corporate earnings is much better than was feared, which became one of the main catalysts for the quick and extensive rebound from the lows. However, longer term earnings growth expectations are decreasing quite significantly. Now global corporate earnings are expected to grow 7%, compared to over 11% just 4 months ago.
Are investors already pricing in a trade agreement between US and China?
As the deadline given by Trump for the conclusion of trade agreement with China is approaching there is not much information on the progress of the negotiations. The overall consensus is that both countries as seeking to reach an agreement as both economies are suffering from the tariffs. Therefore deal may be presented as victory for both US and Chinese leaders. As a result, part of the recent equity market gains may be explained by investor optimism on this issue.
Although a trade agreement is very likely, there is no certainty on the timing. And there is a big chance that the agreement will not be reached by the March 1st deadline.
Global economic growth continued slowing
Global Purchasing Managers’ Index (PMI), which is indicator of economic health and provides information about current business conditions has been trending down compared to a year ago. Still, the value of the index for both manufacturing and service sectors is still above 50, which indicates economic growth. However the downtrend in the PMI is a sign of a slowdown in economic growth.
Also the OECD Composite Leading Indicator (CLI) is designed to provide early signals of turning points in business cycles has been staying below 100. Such level indicates a slowdown of economic activity ahead.
Summary economic indicator
| Value | 1 month change | 1 year change | |
|---|---|---|---|
| Global Manufacturing PMI | 50,7 | -0,7 | -3,6 |
| Global Services PMI | 52,6 | -0,4 | -1,5 |
| Global Composite PMI | 52,1 | -0,6 | -2,4 |
| OECD Composite Leading Indicator | 99,3 | 0 | -1,1 |
Source: Bloomberg, OECD.org
As a result, analysts have started adjusting world economic growth expectations lower. The IMF has cut its global growth forecast cut to 3.5% for 2019 and to 3.6% for 2020.
From the positive side however, such slowdown is helping keep inflation at very moderate levels. Consequently, global central banks have more room to keep accommodative monetary policies. This has led the Fed to pause its tightening cycle, pledging to be patient with any new rate hikes. Also the ECB is expected by the market to postpone its planned rate hike to at least year 2020.
US 2-year treasury yield, %
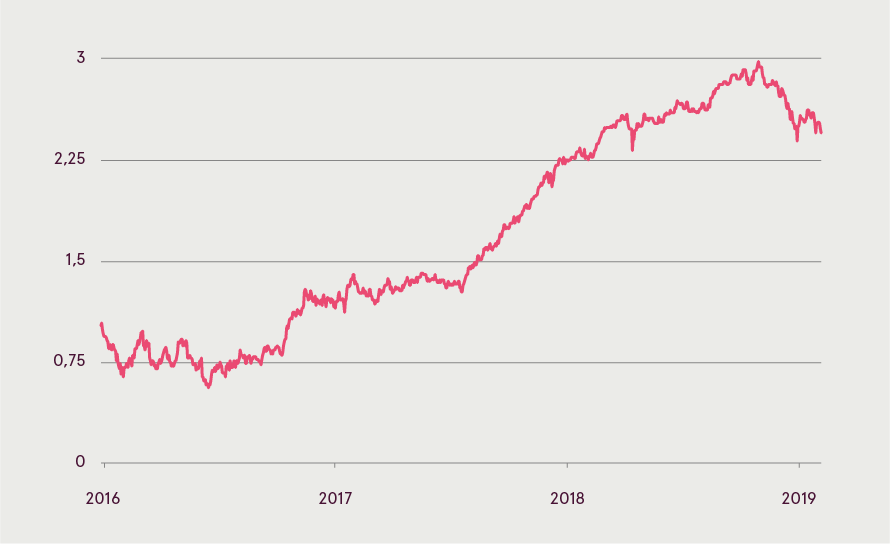
Source: fred.stlouisfed.org
As a result, interest rates have come down quite significantly eliminating one more potential headwind for the global equity markets.
Outlook
Global economic slowdown, many political and geopolitical uncertainties, decreasing earnings growth expectations are all quite significant risks for the short term global equity outlook. Moreover, the speed and magnitude of the rebound from the lows may indicate that investors got too optimistic. Therefore in the short term investors have to be prepared to high volatility with wider than usual fluctuations. However, there are several signs that the long term outlook for stocks should be fairly positive.
First, the global stock market valuations have come down to average historical levels, meaning that stocks are fairly valued. Moreover, emerging market equities continue to be cheap both relatively to developed markets and in absolute terms, compared to historical averages.
Forward P/E*
| Current | |
|---|---|
| Developed Markets ex US | 12,7 |
| All Country World Index | 14,1 |
| Europe | 12,3 |
| Emerging Markets | 11,4 |
| USA | 16,0 |
* - price divided by the 12-m forward earnings estimate
Source: Yardeni Research, Inc.
Second, historical data shows that buying after a significant drop in prices has increased the odds of the positive 5 year return. Also the average expected return increased from 47% to 56% (based on MSCI World index).
MSCI World 5 year returns*
| Probability of positive return | Average 5Y return | Minimum 5Y return | Maximum 5Y return | |
|---|---|---|---|---|
| Rolling 5 year periods since 1969 | 80% | 47,1% | -29,9% | 276,2% |
| Buying after signigicantly negative month** | 90% | 56,0% | -9,2% | 188,0% |
* - based on monthly historical data since 1969
** - monthly return is considered significantly negative if it exceeds 2 times the average monthly decline (for this period bigger than 6.5% monthly loss was considered significant).
Source: MSCI, Luminor calculations
Third, in Q4 last year investors have pulled the record amount of money out of financial since the financial crisis of 2008. This means that when the uptrend resumes, investors will have plenty of cash available to support it.
Subject to changes in circumstances, the opinions given in the Overview may differ from current ones, which is why Luminor bears no responsibility for the timeliness of the opinions presented in the Overview.
This Overview should not be deemed an investment consultation or an offer to invest in financial instruments, make financial transactions or act in any other way. The Overview may not be interpreted as Luminor’s confirmation or promise of occurrence of the events reported in the Overview. The data presented is not connected to any potential information receiver’s specific investment goal, financial situation nor any specific needs.
The historical yield of securities described in this Overview is for reference only. The historical yield may not be considered as a guarantee for future investment results, as the real yield may differ considerably from the one referred to herein.
Luminor shall not be held liable for any loss that the customer might incur due to relying on information contained herein. Before making any investment or credit decision it is recommended to use the help of a respected professional and evaluate the suitability of the investment product or service to the customer’s risk profile and goals.
The terms and conditions of financial instruments and investment fund prospectuses can be found on the Luminor homepage www.luminor.lv. This material may not be copied, distributed or published in any form without Luminor’s prior written consent.