Financial markets update: April 2018

- After two volatile months global equities are still just 7.3% below their all-time record levels.
- In Q1 2018 global equities had 5 times more days with over 1% moves than during the whole year 2017
- Trade war fears and technology sector potential regulation were behind the second leg of an equity price correction
- Despite the recent price decline investors continue to pour money into technology sector funds in expectations of strong earnings growth
- US companies are leading global corporate earnings growth with around 18%y/y increase expected for Q1 2018
- European corporate earnings are expected to grow 3%-4% in Q1 2018
- Correction in equity prices helped reduce excessive positive investor sentiment and positioning, eliminating the headwind for further price growth potential
Out of the last 17 months only 2 were negative for global equities
After a price rebound from the lows in the second half of February, selling pressure and volatility returned in March and markets have witnessed a second negative month in a row. Investors, however, have to take into account that until then the world equity markets posted positive returns for 15 consecutive months. This means that during the last 17 months there were only 2 when the markets declined.
The latest selling brought global equity markets into negative performance territory for the current year. The All Country World index ended March being -3.7% for the year. Developed markets were leading the decline with a -4.1% YTD performance, while Emerging markets were fairly resilient with just a -1.3% loss YTD.
Looking at the performance numbers above, one has to consider two important points. First, equity markets on average experience about a 10% decline each year, so such corrections are perfectly normal. Second, global equities are still just 7.3% below their all-time record levels.
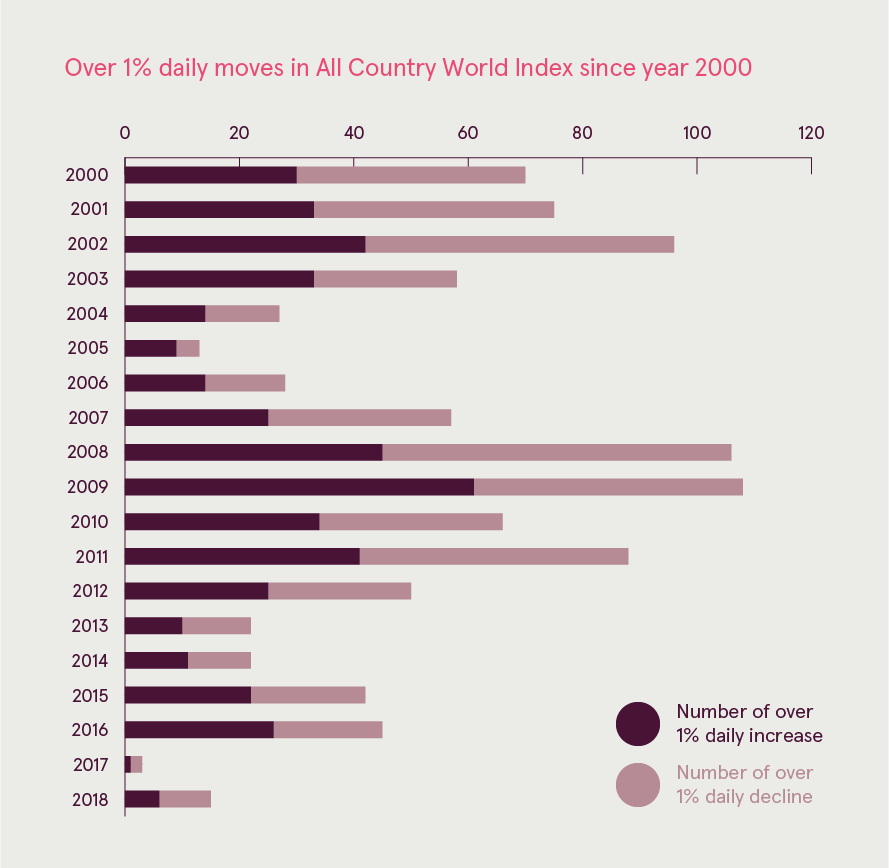
Q1 of 2018 saw more 1% daily moves that year 2017
The year 2017 was truly extraordinary in terms of market volatility, which has been extremely low. During the entire last year the All Country World Index (ACWI) registered only 3 days with over 1% moves. During this year’s three months, there have already been 15 such days. As a result, current volatility may seem extreme. However, if we take a longer perspective, then since the year 2000 there have been 52 days with over 1% move per year on average. Therefore, the current volatility level is perfectly normal and is not a signal of a bear market. For example, during the current uptrend there were fifty 1% days in the year 2012 and 45 in 2016. Consequently, investors have to be prepared for higher volatility going forward, but it shouldn’t be feared, as it may provide good opportunities for adding funds to the market.
Trade wars and technology sector potential regulation is what concerned investors in March
After a long and steady increase in prices investors usually become accustomed to positive news and any slight change in narrative may quickly change the sentiment. That is what we first witnessed in February, as expectations of higher interest rates started the current correction.
March also had its share of negative news which sparked the second round of selling. First was the fear of a full-blown trade war starting that made investors nervous. That all began with Trump’s move to impose tariffs on steel and aluminium, which mostly impacted China. As a result, China has retaliated with tariffs on imports of 128 American-made products. Understandably, trade wars are always bad for the global economy. However, experts believe that the situation most probably shouldn’t escalate further, as that is not in anyone’s favour. The tariff decision is actually believed to be a strategic move to attain additional bargaining power during trade talks.
Additional fuel to the fire was added by the scandal over Facebook users’ private data usage. That sparked investors’ concerns that new regulations may be coming to the industry and actually led to a drop in the whole technology sector equity prices. Due to the fact that the technology sector was the biggest driver of price increases, the move down also reinforced a correction in the general market.
What is important however, is that in general investors didn’t flee the technology sector. On the contrary, they have added to positions during the decline. According to Thompson Reuters, for the week ending March 28, 2018, when the average technology fund dropped 6.29%, investors added 101 million USD to technology sector funds. Moreover, for the year-to-date period in 2018 technology funds have taken in 9.2 billion USD net. With the Q1 2018 earnings season approaching, this fact shows investors’ confidence in the sector, which has exceptional earnings growth expectations.
Q1 2018 earnings reporting season is expected to be positive continuing the 2017 trend
Earnings growth in 2017 was the main driver of global equity price increases. Global equities provided around 20% return in local currencies in 2017, while the earnings grew approximately 16.5%. This means that almost the whole return can be explained by earnings growth and not the equities getting more expensive.
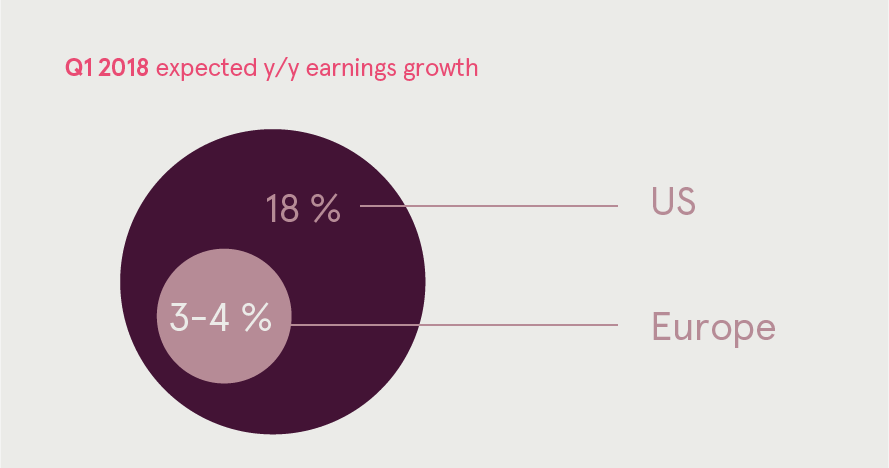
For Q1 2018 US companies had the highest earnings growth expectations globally. Improving economic growth, a cheaper USD and a boost from tax reform drove expectations to around 18% earnings growth year on year. Moreover, there is a high possibility that actual results will exceed the expectations.
In Europe expectations are much more conservative, as earnings are expected to increase just 3-4% in Q1. The earnings growth is in part dragged down by a stronger euro, which reduces export competitiveness and diminishes the value of international revenue. Additionally, the lack of an IT sector, which looks to be the main global earnings growth driver, is also a drag on European earnings.
In Emerging markets, fairly stable commodity prices and robust global economic growth should support corporate earnings in the region.
Price correction hampered investor sentiment
As we have previously noted, investor sentiment is usually a contrary indicator, meaning that a too bullish sentiment is usually negative for the market and vice versa. According to an American Association of Individual Investors survey, the general sentiment became much more bearish in the face of the correction. 35.3% of investors are actually expecting price declines to continue, while only 31.9% are waiting for an increase.
Also, a Bank of America Merrill Lynch (BAML) survey of global fund managers shows the retreat in the equity allocations of the global fund managers from the bullish extreme seen in January. The equity overweight after the correction has dropped from +55% to +41%.
Although the abovementioned sentiment readings are not in extremely negative territory, the bullish excesses have been worked off and sentiment shouldn’t be a headwind for a further upside in equities.