Exceptional earnings: a prerequisite for uptrend?
  • Global equities continued their ascent as All Country World Index reached new all-time high
  • The yield curve in the US flattened further, but historically current levels resulted in positive returns from stocks
  • Despite already very high expectations, 78.6% of all the S&P500 companies have reported earnings that exceed analysts’ expectations
  • Expected Q2 earnings growth rate in Europe is 8.7% and close to 50% of companies that reported so far exceeded expectations
  • Equities are not cheap, but considering the strong earnings growth current valuation levels look reasonable

Global equities continued their ascent as All Country World Index reached new all-time high

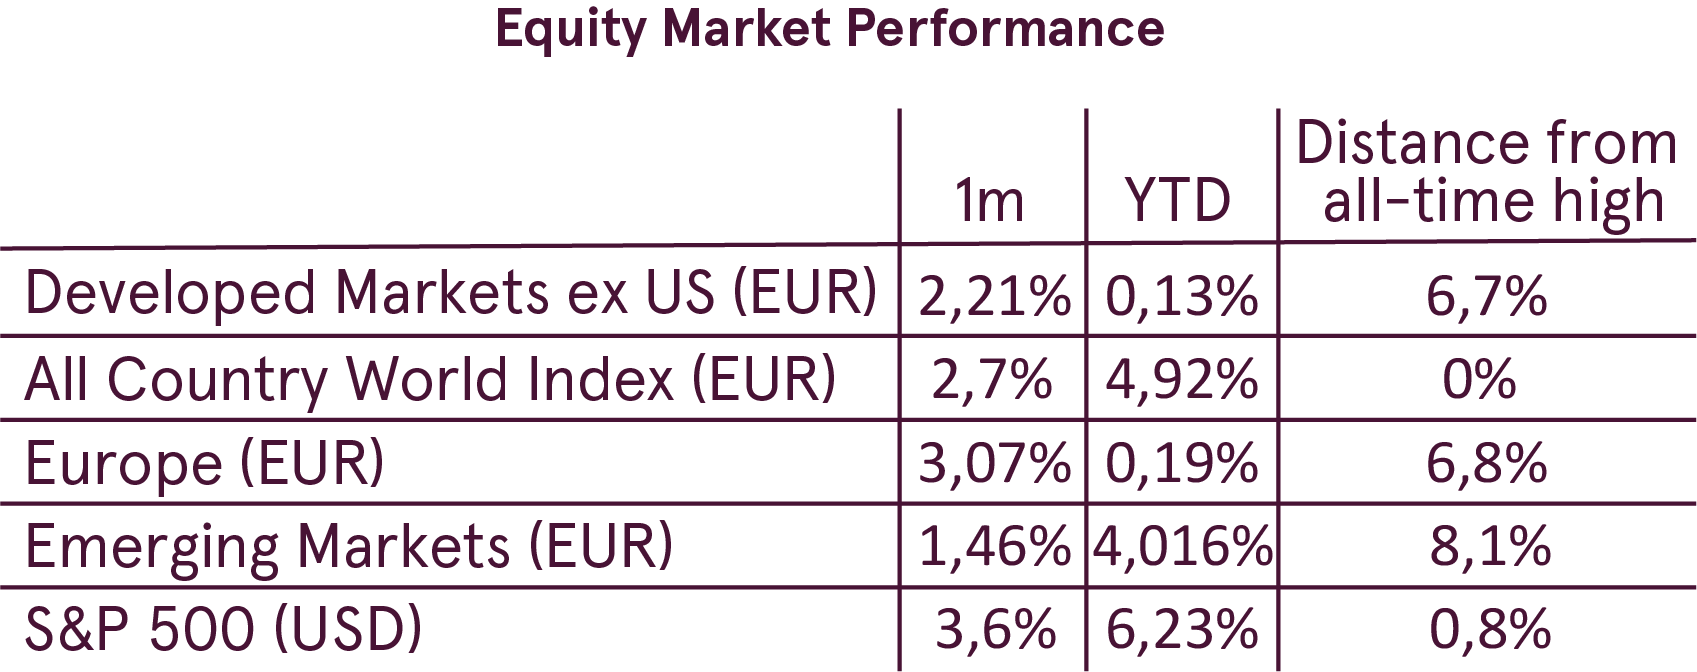
July was a good month for risky assets and global stocks finished the month with a gain, buoyed by very strong earnings season. Risk-on sentiment continued also on the first trading days of August and propelled the All Country World index to new all-time high (in EUR). The index is now up 4.9% year-to-date after an 2.7% increase in July.

US equity market was once again the main driver, supported by fastest earnings growth as the tax cut effects are showing up in the earnings. The S&P 500 rose 3.6% in July and remains less than 1% below its all-time high.

Emerging market equities are still down since the beginning of the year, but managed to gain 1.5% in July, continuing the rebound from the lows.

Bond yields did not experience any big moves rising slightly in both EU and US. In the US the yield curve continued flattening, as 10-year yield is stuck stubbornly below 3%, while the short term yields are rising in a reaction to the Fed tightening.

The yield curve in the US flattened further, but historically current levels resulted in positive returns from stocks

Movements in the yield curve once again came on investors’ radar, as the spread between the 10-year and 2-year yields just dropped below 0.3%.  The reason for such close scrutiny of the yield curve movement is the fact that historically the inversion of the curve, which means that short term rates rise higher than the long term rates, has indicated an upcoming recession with a lead time of about a year.

We have also touched this topic in our May issue of the market overview, where we noted that the curve is still quite far from being inverted and historically the stock market returns were positive in 1 and 3 years following similar levels of the yield curve. Analysis shows that also the decline to the current levels of the yield curve were historically followed by positive S&P 500 returns. Since the year 1976 when the 10-2 year yield spread moved below 0.3% the S&P 500 returned 16.3% and 47.9% on average during the following 1 and 3 years respectively. This is significantly better than the average 1 and 3 year returns for this period of 9.2% and 30.6% respectively.

Moreover, there is additional evidence that can support the argument that this time even the full inversion of the yield curve may not actually signal any trouble ahead.

First, in addition to the yield curve it is important to also take into account the current level of the interest rates and inflation. Recessions are usually caused by the credit crunch that happens when Central bank raises rates aggressively to too high levels trying to combat the excessive inflation and overheating economy. Since the year 1976 when the US yield curve inverted, 2-year yield was 8% and inflation 5.1% on average. Currently 2-year yield is below 2.7%, while core inflation is around 2.3%. As there is no significant inflation pressure now the Fed is not in a rush to raise rates and does so gradually, taking into account the current macro data.


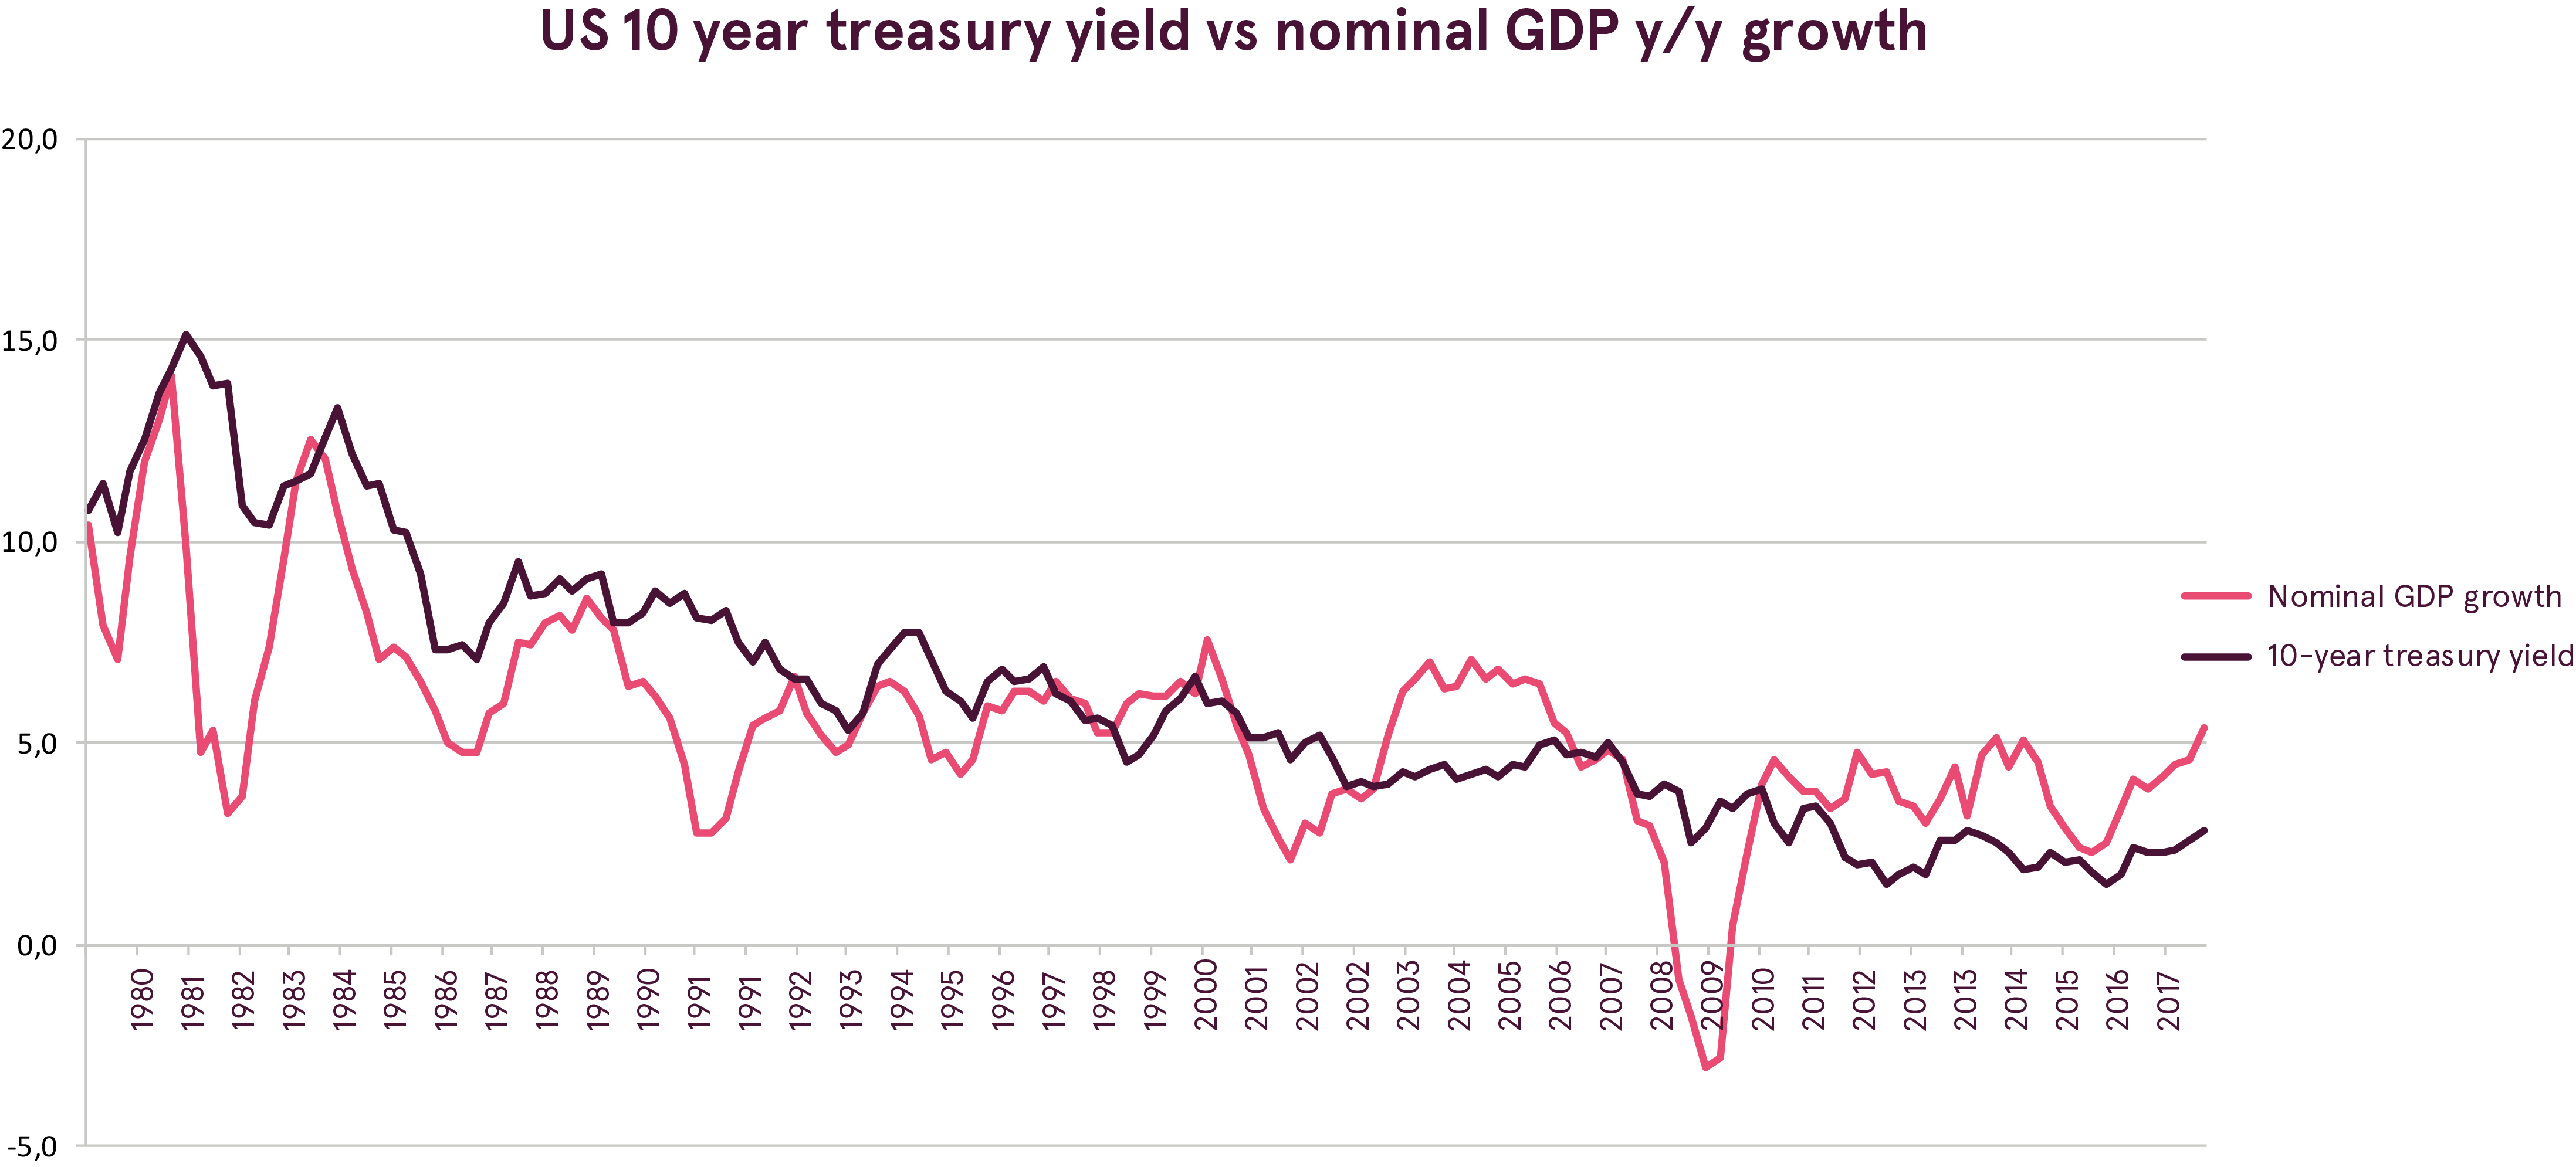
Secondly, globalization of the bond markets and the negative interest rate policies of the ECB and the Bank of Japan (BOJ) may be distorting the US 10-year yield contributing to the flattening of the yield curve. Both the ECB and the BOJ lowered their official rates to below 0, which dragged also the 10-year yields in EU and Japan to close to zero. As a result, more investors are choosing the US bonds looking for better yield. And taking into account a large amount of wealth that was created since the year of 2009, a big part of which is still being allocated to safe bonds, those flows can easily push down US 10-year yield. Supporting that argument is the following interesting observation. As the history has shown, 10-year Treasury yield tends to trade around the year over year growth rate of the nominal GDP. However since the mid-2010 it has consistently been below nominal GDP growth. And now that spread is close to the widest since then, as the nominal GDP was growing 5.4%, while the bond yield is around 3%.

Q2 earnings season is exceeding expectations and future guidance is also strong

The Q2 2018 earnings season is turning out exceptionally strong, especially in the US. Despite already very high expectations, 78.6% of all the S&P500 companies have reported earnings that exceed analysts’ expectations. The latest data shows that the second quarter surged 23.5% from Q2 2017 in the US. Importantly, also the revenues are growing a healthy 9.2%, confirming that the earnings growth is not only due to the effect of the tax reform.

In comparison with the US, European Q2 corporate earnings are more moderate, but the growth is still robust. The expected Q2 earnings growth rate in Europe is 8.7% and close to 50% of companies that reported so far exceeded expectations.

For investors, however, forward earnings are the most important, as they are the main driver of the stock market. And current estimates and forward guidance support continuation of the uptrend. Cheaper euro should help improve European earnings, which are expected to reach double-digit growth during the next year.

In the US, as the effect of the tax cuts disappears, earnings growth will naturally slow down from the current levels. However, the market still expects earnings growth to continue running above 10%.

Equities are not cheap, but considering the strong earnings growth current valuation levels look reasonable

Current equity valuation is often voiced as a concern by investors, as many consider equities to be expensive. Although definitely not cheap, the extent of expensiveness depends on the measures used.
Although the growth in earnings has helped improve the picture, the trailing P/E ratios (using the past earnings) are well above historic averages. The Cyclically Adjusted P/E ratio for the All Country world index is currently at 21.8, compared to a median of 18.4. Emerging market equities are cheaper at 14.1, but are still not too cheap and are close to the long term median of 15.9.


Yet as the stock market is discounting the future expectations, the forward PE (price divided by the 12-month forward expected earnings) should provide a better gauge of the current valuation. Looking at the forward PE, the picture is much better and equities look more fairly priced. The forward PE for the US is now at 17.1, All Country World index has a forward PE of 15, while Emerging market equities trade at just 11.4 forward PE.

Outlook

Summing up, the current environment continues to be supportive for risky assets. Global economy is growing at a healthy pace. The lack of inflation pressures allows for the central banks to keep global monetary policy at the accommodative stance and the tightening process is very gradual.
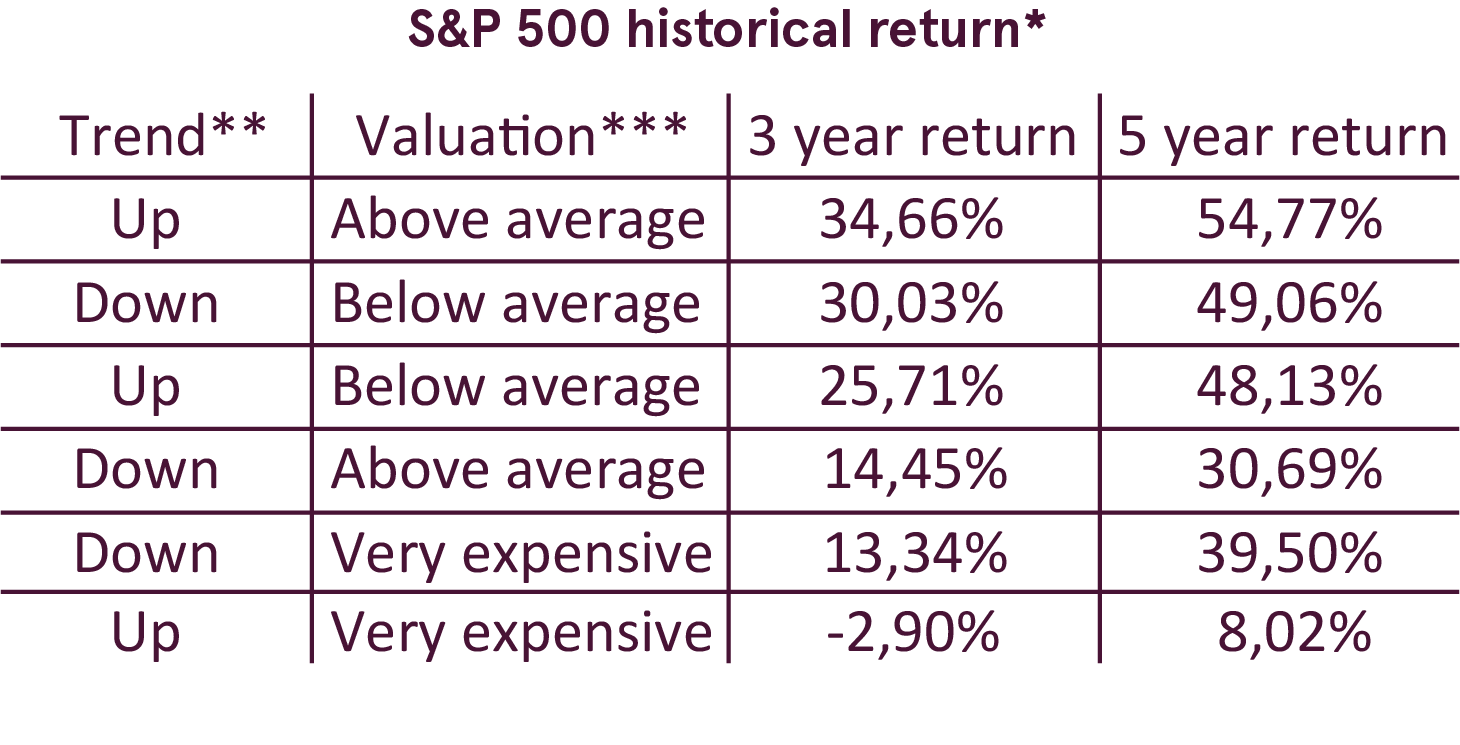
Equity valuation should not be a big concern to investors, as historically equities have provided good returns in 3 and 5 year perspective in the similar situation to the current - when they were in the uptrend (above 10-month moving average) and above average valuation. Only when the valuation gets extreme (more than 1 standard deviation above average) does return outlook deteriorate significantly, but we are far from those levels.


The main risk to our outlook is the possible escalation of the trade wars and the resulting impact on the economy and earnings. However, it is really impossible to predict actions of the politicians and thus how it will all play out. Therefore we follow closely the developments in this area, taking into account that volatility may be increased as events unfold.

Despite the uptrend in global equities still being intact and equities being relatively more attractive than bonds, we acknowledge that political risks are increasing. This may result in higher volatility and warrants a cautious stance. Therefore we keep equities in neutral weight to acknowledge the potential risks, despite economic and earnings outlook still being positive.

Within equities we favor North American region due to strong forward earnings expectations. Additionally, we overweight Emerging Asia and China in particular due to favorable valuation and improving outlook.

Emerging market bonds continue to be the most attractive within fixed income, as they still provide a fairly good yield, while improving macro conditions should help reduce the credit spread.

DISCLAIMER

Luminor Bank AS (hereinafter referred to as Luminor) gives advice to private customers and small and medium sized companies regarding investment strategy and concrete generic investment proposals. The advice includes allocation of the customers’ assets as well as concrete investments in international equities, bonds and similar securities.

Disclosures and disclaimer

Origin of the publication

This publication originates from Luminor’s Investment Advice Development Department (hereinafter referred to as IAD). Luminor is supervised by the Estonian Financial Supervisory Authority (Finantsinspektsioon).

Content of the publication

This publication has been prepared solely by Anton Skvortsov, Investment Advice Development Manager.

Opinions or suggestions from the IAD unit may deviate from recommendations or opinions presented by Luminor Markets. The reason may typically be the result of differing time horizons, methodologies, contexts, risk assessments, portfolio considerations or other factors. Opinions, price targets and calculations are based on one or more methods of valuation, for instance cash flow analysis, use of multiples, behavioural technical analyses of underlying market movements in combination with considerations of the market situation, interest rate forecasts, currency forecasts and the time horizon. Key assumptions of forecasts, price targets and projections in research cited or reproduced appear in the research material from the named sources.

The date of publication appears from the research material cited or reproduced.

Opinions and estimates may be updated in subsequent versions of the publication, provided that the relevant company/issuer is treated anew in any later versions of the publication.

This publication has not been reviewed by the issuers of the relevant financial instruments mentioned in the publication prior to its publication.

Validity of the publication

All opinions and estimates in this publication are, regardless of source, given in good faith, may only be valid as of the stated date of this publication and are subject to change without notice.

No individual investment or tax advice

The publication is intended only to provide general and preliminary information to investors and shall not be construed as the sole basis for an investment decision.

This publication has been prepared by Luminor as general information for private use of investors to whom the publication has been distributed, but is not intended as a personal recommendation of particular financial instruments or strategies and thus it does not provide individually tailored investment advice, and does not take into account your particular financial situation, existing holdings or liabilities, investment knowledge and experience, investment objective and horizon or risk profile and preferences. The investor must particularly ensure the suitability of his/her investment as regards his/her financial and fiscal situation and investment objectives.

The investor bears all risks of losses in connection with an investment. Before acting on any information in this publication, it is recommended to examine the specific terms and conditions of investment products or services and consult one’s financial advisor.

The information contained in this publication does not constitute advice on tax consequences of making any particular investment decision. Each investor shall make his/her own appraisal of the tax and other financial advantages and disadvantages of his/her investment.

Sources

This publication may be based on and contain information, such as opinions, recommendations, estimates, price targets and valuations which emanate from: IAD, publicly available information, information from other units of Luminor or other named sources. Luminor has deemed the Other Sources to be reliable but does not guarantee the accuracy, adequacy or completeness of the External Information.

The stated prices are the closing prices at the stock exchange unless expressly stated otherwise. The perception of opinions or recommendations such as Buy/Sell or similar comparable expressions may vary depending on, for example, the source and the type of financial instrument in focus, and the definition is therefore where appropriate shown in the research material or on the website of each named source.

Limitation of liability

The liability of Luminor may not be engaged as regards any investment, divestment or retention decision taken by the investor on the basis of this publication. Luminor shall not be liable for direct, indirect or incidental, special or consequential damages resulting from the information in this publication regardless of whether such damages were foreseeable or unforeseeable.

Risk information

The risk of investing in certain financial instruments, including those mentioned in this document, is generally high, as their market value is exposed to many different factors such as the operational and financial conditions of the relevant company/issuer, growth prospects, change in interest rates, the economic and political environment, foreign exchange rates, changes in credit rating, liquidity in the market, shifts in market sentiments, etc. In case of a company´s/issuer’s insolvency or similar circumstance there may be periods when the financial instrument issued by the company/ issuer cannot be traded. Where an investment or security is denominated in a different currency than the investor’s currency of reference, changes in rates of exchange may have a positive or negative effect on the value, price or income of or from that investment to the investor. Important disclosures of risks regarding investment products and investment services are available here.

Past performance is not a guide to future performance. Estimates of future performance are based on assumptions that may not be realized. When investing in individual financial instruments the investor may lose all or part of his investments.

Conflicts of interest

Luminor may perform services for, solicit business from, hold long or short positions in, or otherwise be interested in the investments (including derivatives) of any company mentioned in the publication.

To limit possible conflicts of interests and counter the abuse of insider knowledge, the advisors and strategists in Luminor are subject to internal rules on sound ethical conduct, the management of inside information, handling of unpublished research material, contact with other units and personal account dealing. The internal rules have been prepared in accordance with applicable legislation and relevant industry standards. The object of the internal rules is, for example, to ensure that (i) no advisor or strategist will abuse or cause others to abuse confidential information, (ii) a physical separation exists between advisors and strategists involved in the production of this publication and other relevant persons whose responsibilities or business interests may conflict with the interests of the persons to whom the investment research is disseminated, (iii) advisors and strategists involved in the production of this publication act in good faith, etc.

It is the policy of Luminor that no link exists between revenues from capital markets activity and individual advisor or strategist remuneration. Luminor does not promise issuers favourable research coverage. The availability of this publication is not associated with the amount of executed transactions or volume thereof.

This material has been prepared following the Luminor Conflict of Interest Policy, which may be viewed here.

Information about personal shareholdings of Luminor advisers and strategists will be disclosed at Luminor’s web page if this issue becomes relevant.

Distribution

This publication does not constitute an offer of services in any jurisdiction where Luminor does not have the necessary license. The securities referred to in this publication may not be eligible for sale in some jurisdictions. This publication is generally public but is intended only for distribution in Estonia, Latvia and Lithuania.

This publication may be distributed by Luminor Estonia, Latvia and Lithuania.

This publication may not be mechanically duplicated, photocopied or otherwise reproduced, in full or in part, under applicable copyright laws.