Are investors prematurely optimistic? | Luminor

Are investors prematurely optimistic?
- The bull market in global equities celebrates its 10-year anniversary with a 200% gain for the All Country World Index
- Global equities continued to rise in February led by European stocks
- Historically, the MSCI World index has finished the year positively 83% of times, after gains in January and February
- The ECB pledged to keep rates unchanged at least throughout 2019
- The uptrend in copper prices may indicate potential outperformance of emerging market equities going forward
Global equity markets gained 200% since the start of the current bull market
As the rebound from December lows continued in February, the All Country World index managed to gain 3.3% for the month, taking the year-to-date gain to over 10%. In Developed market equities were driving the upside whilst emerging market stocks showed a very modest gain of 0.9%. They were mainly impacted by the decline in Latin American stocks, which dropped by 3.6% as a result of profit-taking after a strong performance during the previous 5 months.
Equity Market Performance
| 1m | YTD 2019 | Distance from all-time high | |
|---|---|---|---|
| Developed Markets ex US (EUR) | 3,1% | 9,4% | 10,2% |
| All Country World Index (EUR) | 3,3% | 10,9% | 2,0% |
| Europe (EUR) | 3,9% | 10,2% | 10,6% |
| Emerging Markets (EUR) | 0,9% | 9,2% | 2,0% |
| S&P 500 (USD) | 3,0% | 11,1% | 4,4% |
* - based on monthly data
Source: MSCI, finance.yahoo.com
European stocks stood out with the highest gain for the month, growing by 3.9%. On the year-to-date terms, however, US equities still have the best performance with a gain of over 11%.
March of this year marks the 10-year anniversary of the current bull market in global equities. Since the beginning of the bull market, global equities provided hefty gains for investors. The All Country World index gained 200% over 10 years. The US was the clear leader, outperforming all other regions by a big margin with a gain of 279%. However, the bull market was strong globally and all major regions except Latin America managed to gain over 100% during that period.
The speed and magnitude of the recovery took many investors by surprise
Many analysts are calling the rebound from the December lows a “v-shaped” recovery due to its speed and magnitude. Equity markets went straight up after Christmas. As a result, by the last week of February, the All Country World index registered a gain of 15.2% in only 42 trading days (2 months of trading).
There have only been 9 other such cases in 29 years since 1990, as such gains usually happen after bigger declines. Out of those 9 cases, 7 were followed by a positive return in the following year.
History has also shown that positive January and February months provide favourable odds for the gain for the whole year. Since the year 1970, the MSCI World index finished the year with a gain in 83% of times after positive performance in the first two months.
It is important to remember, however, that such analysis simply provides an overview of historical behaviour and does not imply that history will repeat itself.
The ECB pledged to keep rates at current levels at least throughout the full 2019
The ECB had its meeting in early March, where they confirmed their intentions to keep the EU monetary policy at a very accommodative stance. The Central Bank has pledged to keep the interest rates unchanged at least until the end of 2019, scrapping their plan for a rate hike in December. Additionally, the ECB has introduced a third round of long-term financing facility to support favourable bank lending conditions.
Such moves were made in response to the slowing macroeconomic indicators and benign inflation. The ECB revised its GDP growth estimates to 1.1% for 2019. The Central Bank also expects inflation to stay at the 1.2% level.
As a result of this ECB action, German long-term yields dropped to the lowest levels since October 2016. These developments should provide support to European equities going forward.
Emerging market equities continue to look interesting in the long term perspective
Emerging market stocks have been lagging behind developed markets since the beginning of the current bull market in 2009. However, there are signs that this trend may finally be changing and emerging market equities may outperform developed going forward.
Firstly, emerging market equities are significantly cheaper than developed markets in terms of forward P/E. The MSCI Emerging market index has a forward P/E of 11.7, compared to 16.4 for US and 13.3 for other developed markets.
Secondly, emerging market economies are growing faster than developed which leads to better corporate earnings growth. Emerging market corporate earnings are expected to grow by 7.1% next year compared to 6.2% for developed markets.
Copper price vs Emerging Market/Developed market equity performance
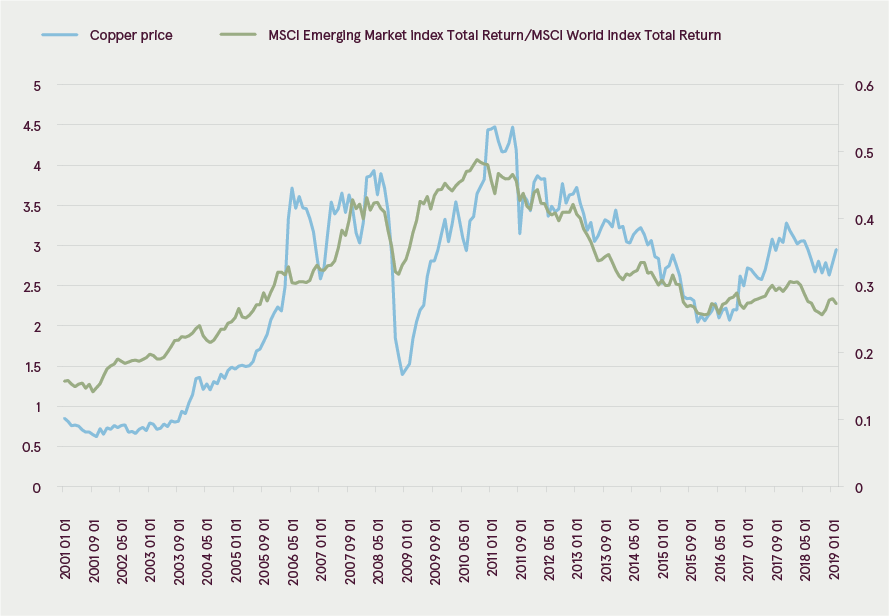
Source: MSCI, investing.com
Moreover, historically, the trend in the price of copper has been a good indicator of the performance of emerging market equities compared to developed markets. The main reason for this is that the industrial sector contributes majorly to the economic growth of emerging countries. Therefore, a rise in copper prices indicates increasing economic activity, and the copper price been uptrending since 2016, signalling potential emerging market equity outperformance.
Finally, the decision of the MSCI to increase the share of Chinese equities in its indices in three steps (May, August and November) should provide additional support to the equities of the region. As there are many ETFs connected to MSCI indices, the increase in the share of Chinese equities would result in a mandatory inflow of significant new money to the stock market of the region.
Outlook
Considering nothing has materially changed in the global economic indicators since the end of last year, the current investor complacency seems quite extreme. The forward-looking indicators continue to point to an economic slowdown in the first half of the year. Only the service sector has shown a slight improvement as the PMI index rose by 0.7 points.
Summary economic indicator
| Value | 1 month change | 1 year change | |
|---|---|---|---|
| Global Manufacturing PMI | 50,6 | -0,1 | -3,4 |
| Global Services PMI | 53,3 | 0,7 | -1,5 |
| Global Composite PMI | 52,6 | 0,5 | -2,2 |
| OECD Composite Leading Indicator | 99,3 | -0,1 | -1,1 |
Source: Bloomberg, OECD.org
The big unknown is still the results of the US-China negotiations on the trade war – recent market action suggests that investors have priced in a positive outcome. However, it remains unclear whether the outcome will satisfy investor expectations. Consequently, there is risk of a correction in the event of a negative result.
Moreover, considering the risks of an economic slowdown and continued trade war issues, investors currently seem too optimistic. According to the American Association of Individual Investors, 32.4% of investors are currently bullish, expecting the market to continue rising. The expected volatility, measured by the VIX index, has also returned to very low levels. As a result, the market may be vulnerable to a correction in the short term.
10-year price return of MSCI All Country World Index at various starting P/E valuations
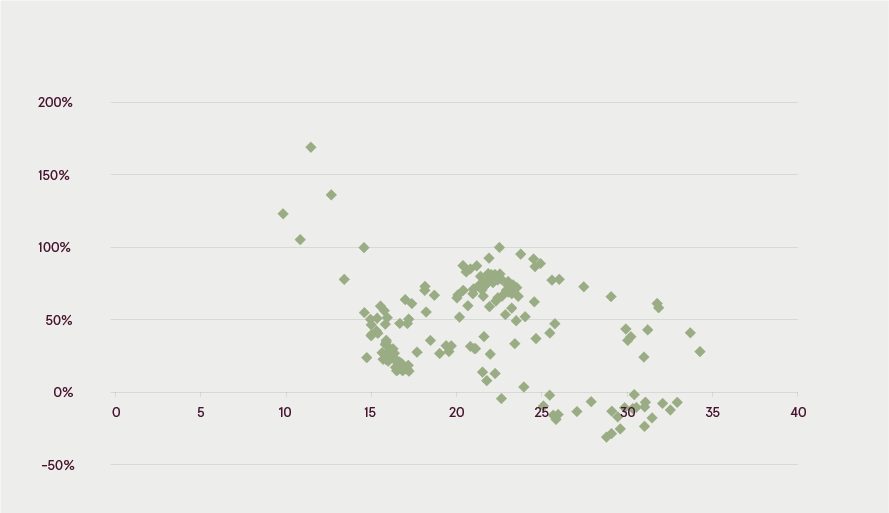
Source: MSCI, Bloomberg
The long-term perspective, though, remains favourable for global equities due to low interest rates, benign inflation and fair valuation. The current P/E level of the All Country World Index is 16.6, which is below its historical average. Moreover, since 1995, there has been no 10-year period in which starting with such valuation equities provided negative return.
Subject to changes in circumstances, the opinions given in the Overview may differ from current ones, which is why Luminor bears no responsibility for the timeliness of the opinions presented in the Overview.
This Overview should not be deemed an investment consultation or an offer to invest in financial instruments, make financial transactions or act in any other way. The Overview may not be interpreted as Luminor’s confirmation or promise of occurrence of the events reported in the Overview. The data presented is not connected to any potential information receiver’s specific investment goal, financial situation nor any specific needs.
The historical yield of securities described in this Overview is for reference only. The historical yield may not be considered as a guarantee for future investment results, as the real yield may differ considerably from the one referred to herein.
Luminor shall not be held liable for any loss that the customer might incur due to relying on information contained herein. Before making any investment or credit decision it is recommended to use the help of a respected professional and evaluate the suitability of the investment product or service to the customer’s risk profile and goals.
The terms and conditions of financial instruments and investment fund prospectuses can be found on the Luminor homepage www.luminor.lv. This material may not be copied, distributed or published in any form without Luminor’s prior written consent.