
2018 was tough, but will 2019 be easier?
- All Country World index dropped 6.7% in the year when global corporate profits rose over 20%
- Bonds did show a positive total return of 0.41%, but that was not enough to cover for losses from equities.
- Historically, MSCI World index has risen next year after the decline with 79% probability
- The average bear market decline in the US was 34.8% in case of recession, while 19.6% without recession.
- Global stocks currently trade at below historical average valuation
2018 – a tough year for investors
Year 2018 was not only especially hard for investors but it was also quite exceptional in many ways. First of all, it was the hardest year for equity investors in almost 10 years as no major region had positive return, while the volatility has risen significantly. Contrary to many investors’ expectations, December did not bring the awaited relief rally, but actually became the worst month of the year. The All Country World index (ACWI) dropped over 8% in that month and ended the year down 6.7% (in EUR).&
Eastern Europe was the best major region in terms of stock market return with a loss of just 3.7% for the year. It was closely followed by the Latin American equities, which declined 4.7% in 2018. Actually the whole emerging market region was holding up quite well during the market turmoil in the end of the year, which helped emerging market equities outperform developed markets. Emerging market equity index slid 6.4% last year. Such outperformance is not surprising, considering that emerging market equities are cheap both in absolute terms and also compared to developed market stocks.
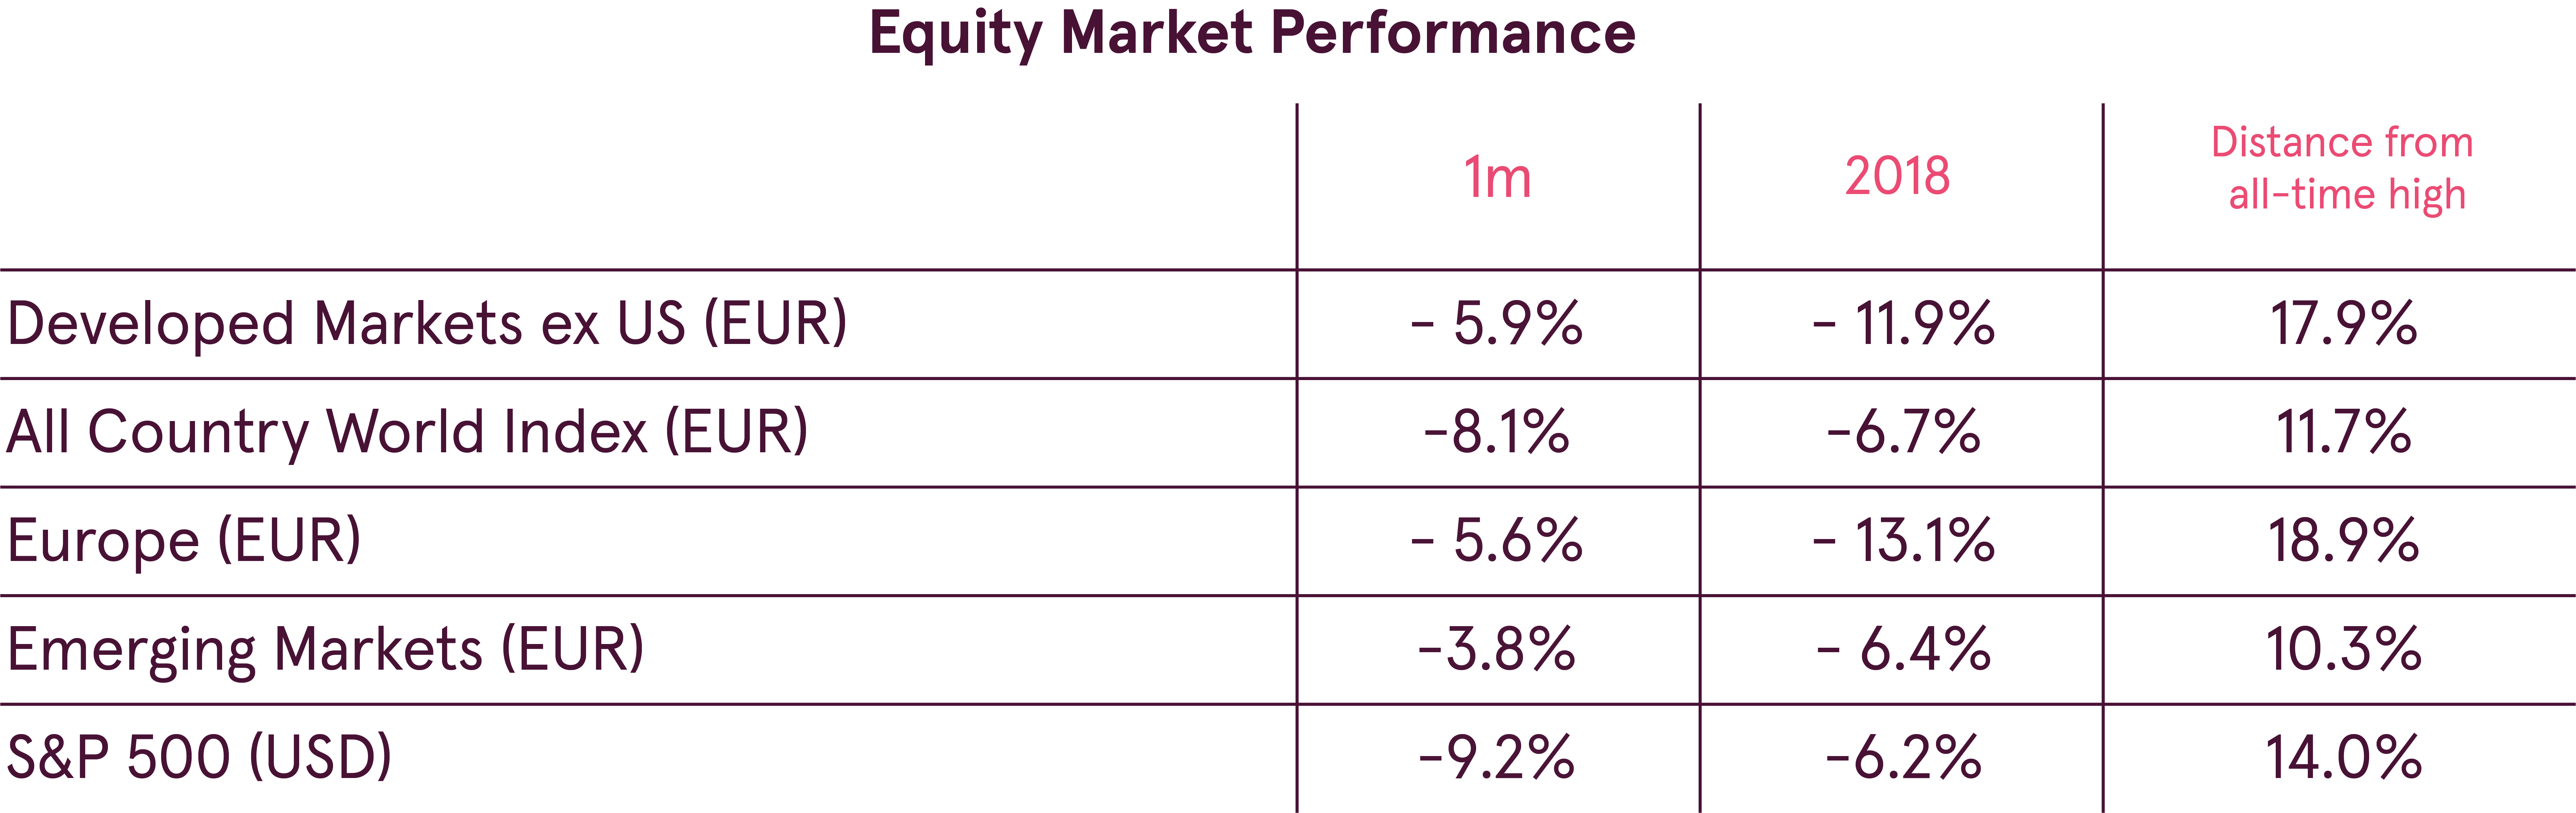
On the other hand, European equities were the worst performers last year. The European equity index plunged 13.1% in 2018. Moreover, many of the European country stock markets have officially entered bear market territory.
Even diversification did not help last year
However, it was a tough year not only for global equity investors. Actually almost nothing worked in financial markets last year. Rising interest rates hampered global bond performance. Consequently, although technically bonds as a whole provided a positive total return in 2018, it was a meagre 0.41%. However, this was clearly not enough to compensate for the decline in global equities.
Also commodities were down last year with Bloomberg Commodity index declining 8.1% in 2018 (in EUR). Energy prices were one of the main drivers of this drop, as global oil supply continued to outpace demand creating increasing inventories. Additionally, a slowdown in Chinese economic growth reduced demand for industrial metals, which also became cheaper and amplified the drop in the index.
Such a year may be quite frustrating for the diversified investor as the diversification is seemingly not working. However it is crucial to not to be distracted by short term set-backs, as investments should be done for the long term. And in the longer term the diversification was academically proven to enhance risk adjusted performance.
2018 was volatile, but well in line with historical averages
Coming back to global equities and comparing 2018 to 2017, the differences are quite drastic. In 2017 ACWI had just 21 days with over 1% move in the index value, of which only 9 were declines. In 2018, however, index experienced over 1% change in value 48 times with 30 of those being drops in price. Moreover, the worst daily drop in 2018 was almost 2 times bigger than in 2018: -2.8% compared to -1.7%. What is more, the worst month in 2017 was a decline of just 1.3%, while the index dropped over 8% in December 2018. As a result, 2018 was much more volatile but the volatility was still slightly below the long term historical average.
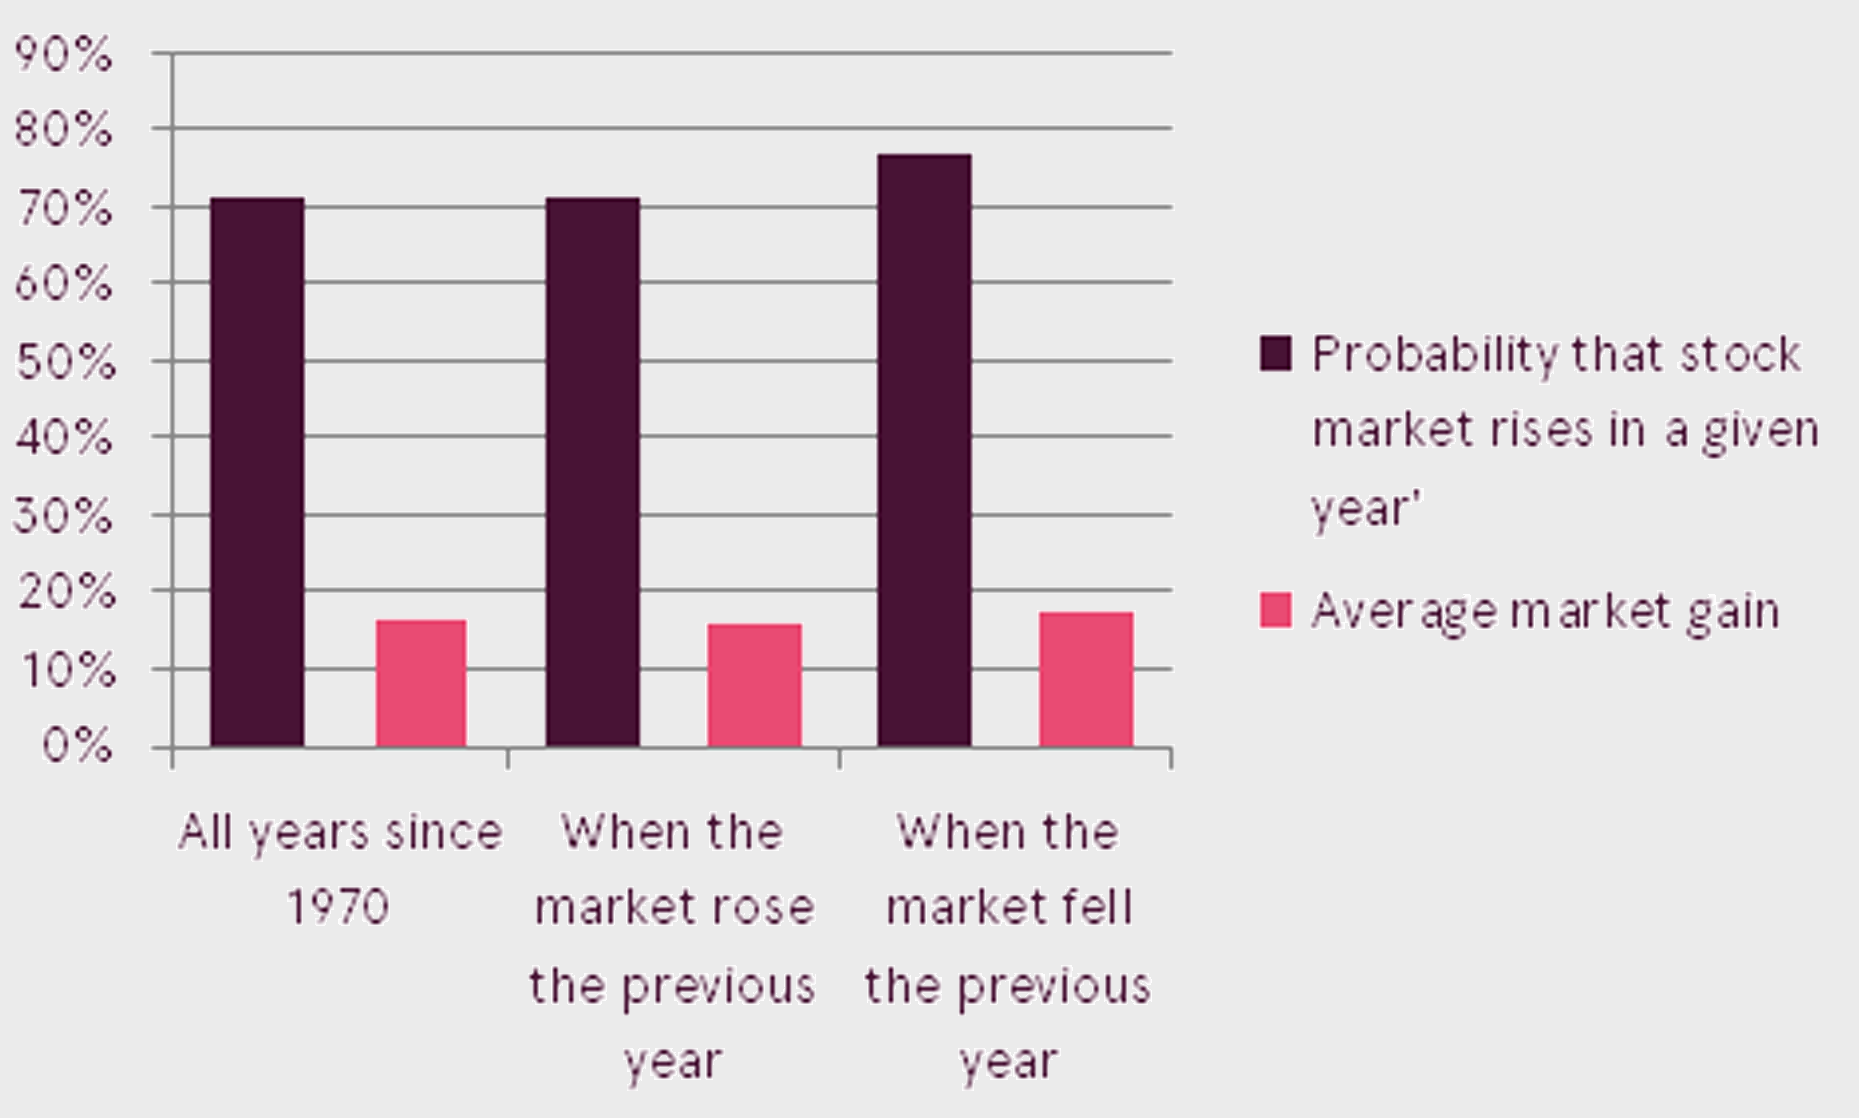
Looking at the longer term market statistics for the MSCI World index, since 1970 the index rose in a given year with a 71% probability in any given year. And the average return in such cases was 16.5%.
After a negative year for the index the probability of the world stocks rising next year actually increased to almost 79%. And the average gain was also higher at 17.6%. Although historical statistics are showing favorable picture investors have to remember that historical returns are not guaranteed and markets can always surprise investors.
If economic contraction will be avoided we have already experienced a correction of historical average magnitude
There were several reasons for the market decline in 2018, including rising interest rates, political and geopolitical uncertainties and trade wars. However the most alarming was the slowdown of global economic growth and deterioration of the forward-looking economic indicators.
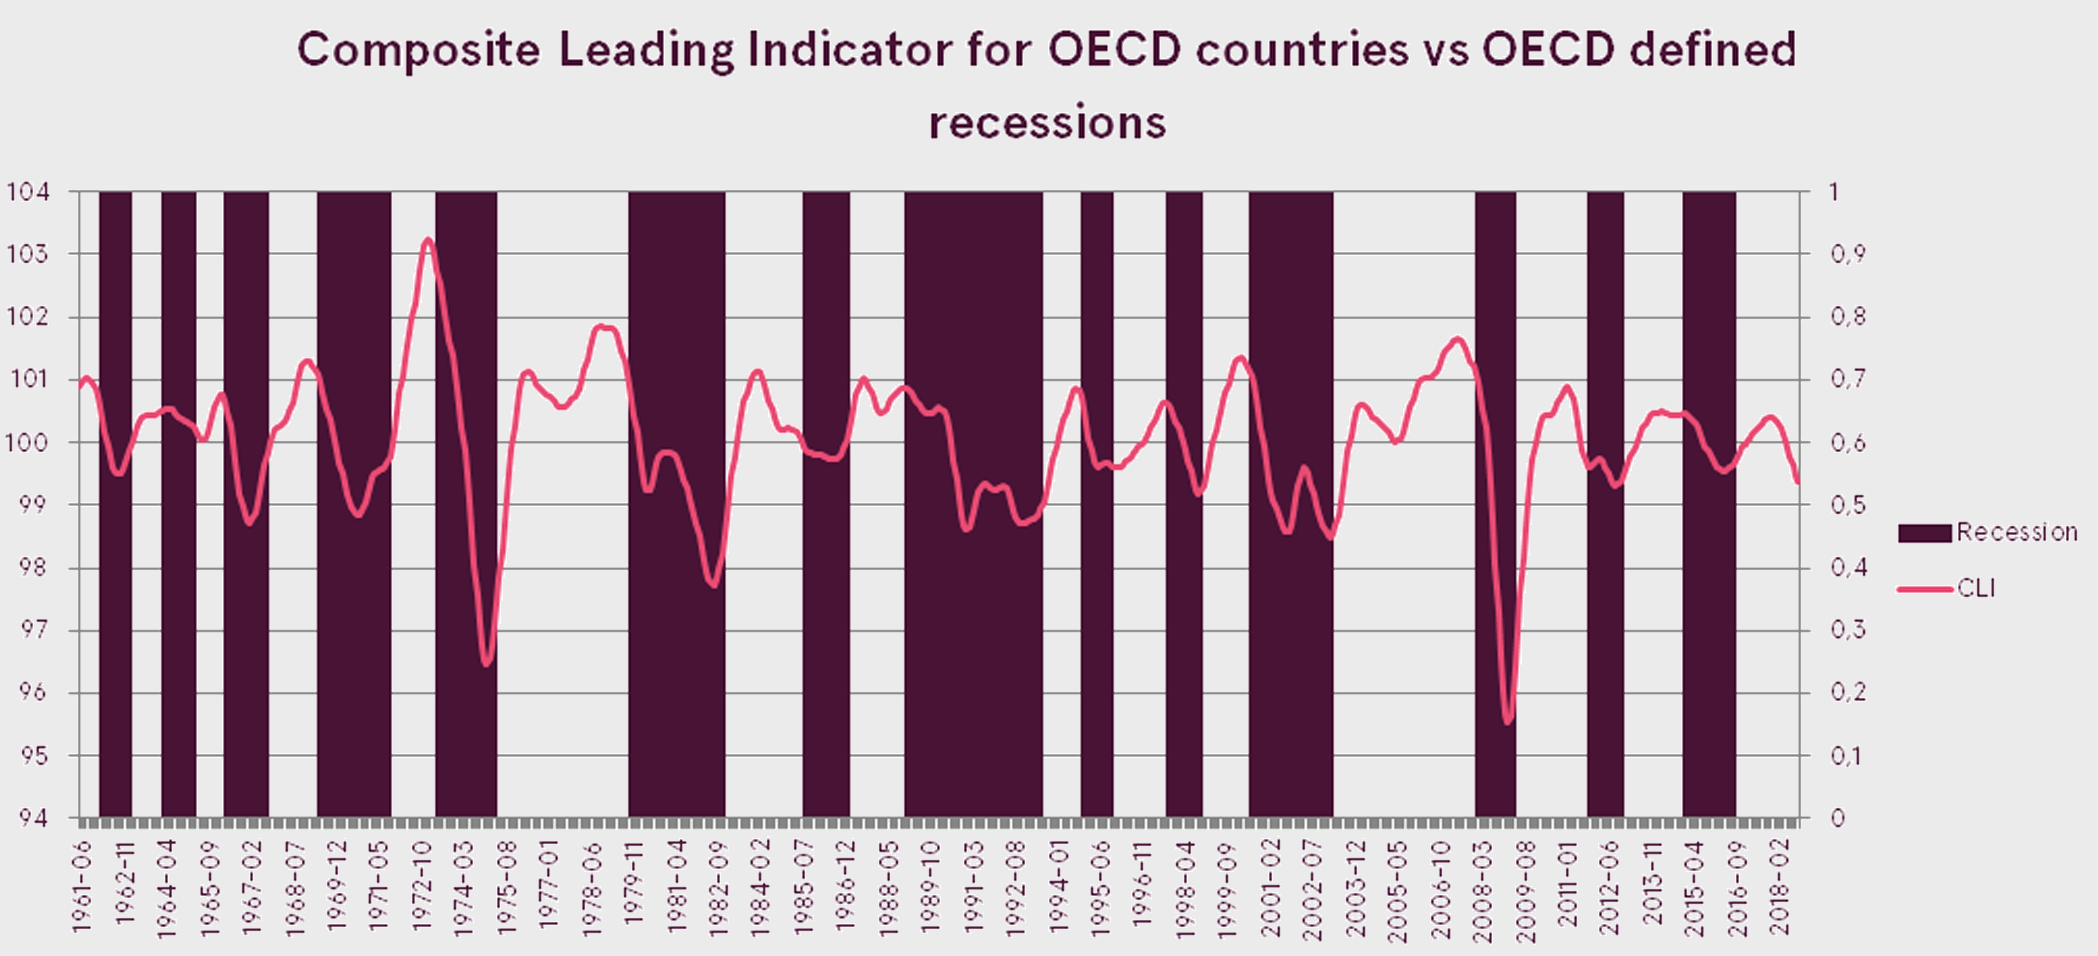
The OECD composite leading indicator, which is designed to provide early signals of turning points in business cycles, dipped below 100. This indicates an expected slowdown in economic activity and has historically coincided quite well with recession. However, it is important to remember that OECD definition of recession does not imply negative GDP growth, but just a significant slowdown.
In favor of a slowdown, not a contraction also speaks the global Purchasing Managers’ Index, which tracks changes in production, new orders, inventories, employment, and prices. The index is still well above 50 it indicates economic growth ahead.
Looking at the US, which is extremely important due to its size, the main indicator currently flashing warning sign is the flattening of the yield curve. At the same time PMI is one of the highest in all developed markets and jobs market is very strong.
Consequently, the overall consensus among economists is that we should expect a slowdown in global economic growth in 2019, while economic contraction should be avoided. That has important implication for equity investors, as stocks drop by a bigger magnitude in case of economic contraction. Looking at the data since the year 1900, the average bear market decline in the US was 34.8% when there was economic contraction. Without a drop in GDP however, US stocks dropped on average 19.6%.
Outlook
Economic growth slowdown forced equity analysts to start reducing their expectations of corporate earnings growth. Although earnings are still expected to grow a very healthy 8% globally, the estimate has been reduced by over 3 percentage points. Such negative dynamic is hurting investor sentiment and causes equities to decline. As a result, the Q4 earnings reporting season will be extremely important, as a better than expected picture may provide a much needed relief for investors.
One positive factor of the slowing economic growth is that central banks do not need to hike rates too fast. Consequently, the market is not expecting any more rate hikes from the Fed this year and is actually pricing in a rate cut possibility in 2020. In case of the ECB, the market assigns just a 36% probability of rate increase in December 2019. Therefore the monetary policy should continue to be very accommodative.
Additional support to the global economy should be provided by the low oil prices, which help keep inflation low and reduce input cost for companies. The biggest risk on the other hand is case no trade deal will be achieved between US and China. That will result in new tariffs being introduced, which can drag not only China but also the US and global economy into recession.
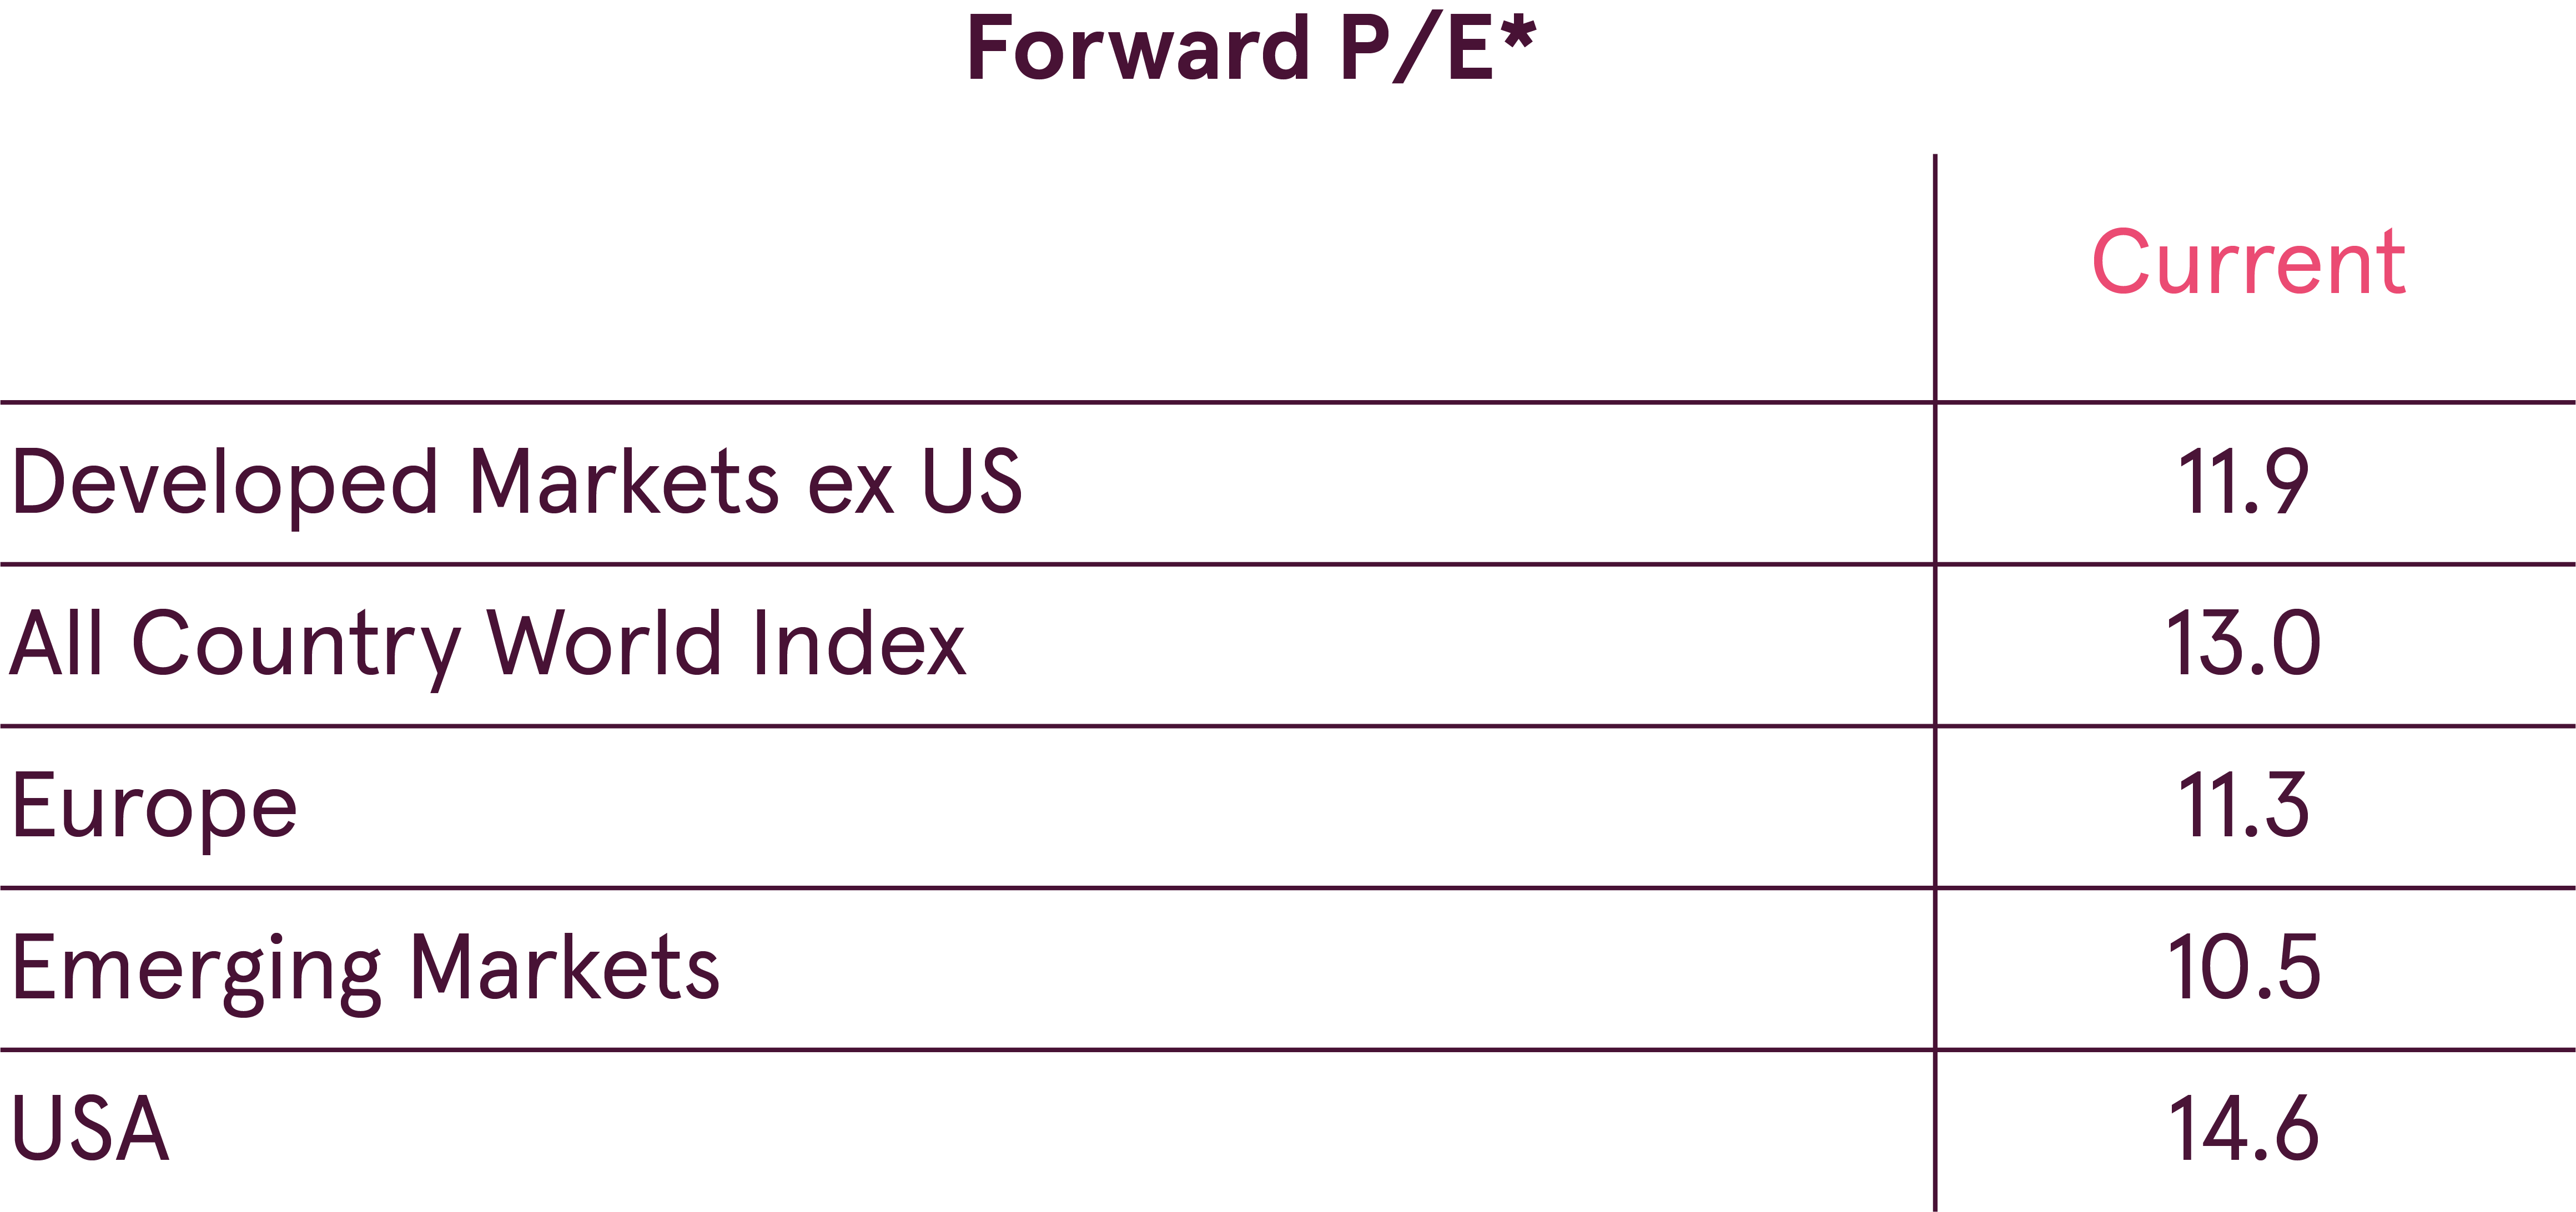
Overall, earnings growth at the time of declining prices made global stocks cheaper. All Country World index is now trading at a P/E below its historical average. Emerging market equities are especially cheap, while developed markets are close to being fairly priced. And although in the short term stocks can always become cheaper, in the long term below average P/E should imply above average returns.
Last year proved the importance of sticking to one’s long term plan and also showed the extreme complexity of timing the markets. Even with perfect foresight, knowing that 2018 would bring over 20% corporate profit growth, record low unemployment in the US and strong global economic growth, who could have correctly identified that equities will drop that year? So utilizing long-term thinking and sticking to the plan should help investors cope with the expected higher volatility.
Warnings
- This Marketing Communication is not considered investment research and has not been prepared in accordance with standards applicable to independent investment research.
- This Marketing Communication does not limit or prohibit the bank or any of its employees from dealing prior to its dissemination.
Origin of the Marketing Communication
This Marketing Communication originates from the Portfolio Management unit (hereinafter referred to as PMU) – a division of Luminor Bank AS (reg. No 11315936, with registered address at Liivalaia 45, 10145, Tallinn, Republic of Estonia, represented within the Republic of Latvia by Luminor Bank AS Latvian branch, reg. No 40203154352, address: Skanstes iela 12, LV-1013, Riga, hereinafter - Luminor). PMU is involved in the provision of discretionary portfolio management services to Luminor clients.
Supervisory authority
As a credit institution Luminor is subject to supervision by the Latvian Financial Supervisory Authority (Finanšu un kapitāla tirgus komisija). Additionally, Luminor is subject to supervision by the European Central Bank (ECB), which undertakes such supervision within the Single Supervisory Mechanism (SSM), which consists of the ECB and the national responsible authorities (Council Regulation (EU) No 1024/2013 - SSM Regulation). Unless set out herein explicitly otherwise, references to legal norms refer to norms enacted by the Republic of Latvia.
Content and source of the publication
This Marketing Communication has been prepared by PMU for information purposes. Luminor will not consider recipients of this Communication as its clients and accepts no liability for use by them of the contents, which may not be suitable for their personal use.
Opinions of PMU may deviate from recommendations or opinions presented by the Luminor Markets unit. The reason may typically be the result of differing investment horizons, using specific methodologies, taking into consideration personal circumstances, applying a specific risk assessment, portfolio considerations or other factors. Opinions, price targets and calculations are based on one or more methods of valuation, for instance cash flow analysis, use of multiples, behavioural technical analyses of underlying market movements in combination with considerations of the market situation, interest rate forecasts, currency forecasts and investment horizon.
Luminor uses public sources that it believes to be reliable. However, Luminor has not performed independent verification. Luminor makes no guarantee, representation or warranty as to their accuracy or completeness. All investments entail a risk and may result in both profits and losses.
This Marketing Communication constitutes neither a solicitation of an offer nor a prospectus in the sense of applicable laws. An investment decision in respect of a financial instrument, a financial product or an investment (all hereinafter “product”) must be made on the basis of an approved, published prospectus or the complete documentation for such a product in question, and not on the basis of this document. Neither this document nor any of its components shall form the basis for any kind of contract or commitment whatsoever. This document is not a substitute for the necessary advice on the purchase or sale of a financial instrument, a financial product.
No Advice
This Marketing Communication has been prepared by Luminor PMU as general information and shall not be construed as the sole basis for an investment decision. It is not intended as a personal recommendation of particular financial instruments or strategies. Luminor accepts no liability for the use of the Marketing Communication content by its recipients.
If this Marketing Communication contains recommendations, those recommendations shall not be considered as an objective or independent explanation of the matters discussed herein. This document does not constitute personal investment advice or take into account the individual financial circumstances or objectives of the persons who receive it. The securities or other financial instruments discussed herein may not be suitable for all investors. The investor bears all risk of loss in connection with an investment. Luminor recommends that investors independently evaluate each issuer, security or instrument discussed herein and consult any independent advisors if they believe it necessary.
The information contained in this document also does not constitute advice on the tax consequences of making any particular investment decision. The estimates of costs and charges related to specific investment products are not provided therein. Each investor shall make his/her own appraisal of the tax and other financial advantages and disadvantages of his/her investment.
Risk information
The risk of investing in certain financial instruments including those mentioned in this document, is generally high, as their market value is exposed to many different factors. The value of and income from any investment may fluctuate from day to day as a result of changes in relevant economic markets (including changes in market liquidity). The information herein is not intended to predict actual results, which may differ substantially from those reflected. Past performance is not necessarily indicative of future results. When investing in individual financial instruments the investor may lose all or part of their investments.
Important disclosures of risks regarding investment products and investment services are available here.
Conflicts of interest
To avoid occurrence of potential conflicts of interest as well as to manage personal account dealing and / or insider trading, the employees of Luminor are subject to internal rules on sound ethical conduct, management of inside information, handling of unpublished research material and personal account dealing. The internal rules have been prepared in accordance with applicable legislation and relevant industry standards. Luminor’s Remuneration Policy establishes no link between revenues from capital markets activity and remuneration of individual employees.
The availability of this Marketing Communication is not associated with the amount of executed transactions or volume thereof.
This material has been prepared following the Luminor Conflict of Interest Policy, which may be viewed here.
Distribution
This Marketing Communication may not be transmitted to, or distributed within, the United States of America or Canada or their respective territories or possessions, nor may it be distributed to any U.S. person or any person resident in Canada. The document may not be duplicated, reproduced and(or) distributed without Luminor’s prior written consent.