
July 2018: Is it time to worry?
- Global equities were slightly down in June, but still just a touch below all-time highs
- Trade war escalates, hurting investor sentiment, but there is still a chance for reasonable resolution
- Bearish sentiment posted the seventh largest weekly increase in the last five years
- Several regions actually experienced bear market declines in the period from 2009-2018
- Investors are fleeing emerging markets, but is the fear justified?
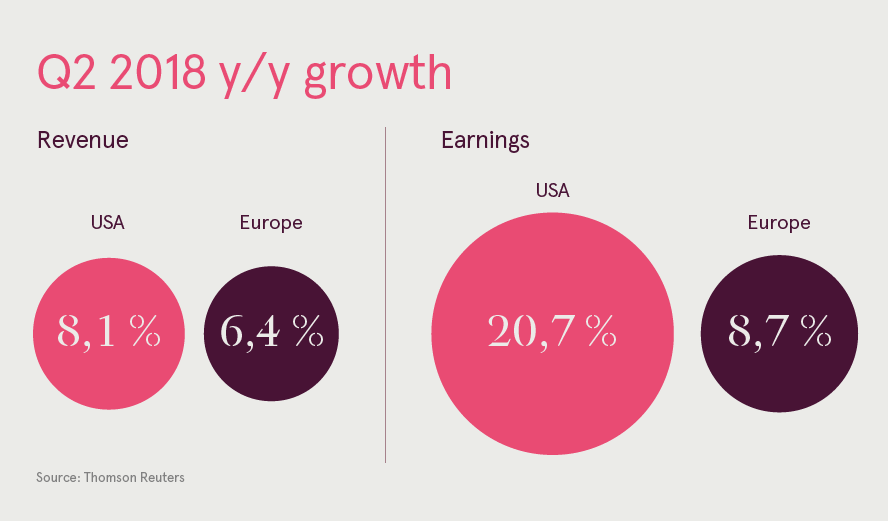
- Strong Q2 earnings growth expected – US 20.7%, Europe 8.7%
Global equities were slightly down in June, but still just a touch below all-time highs
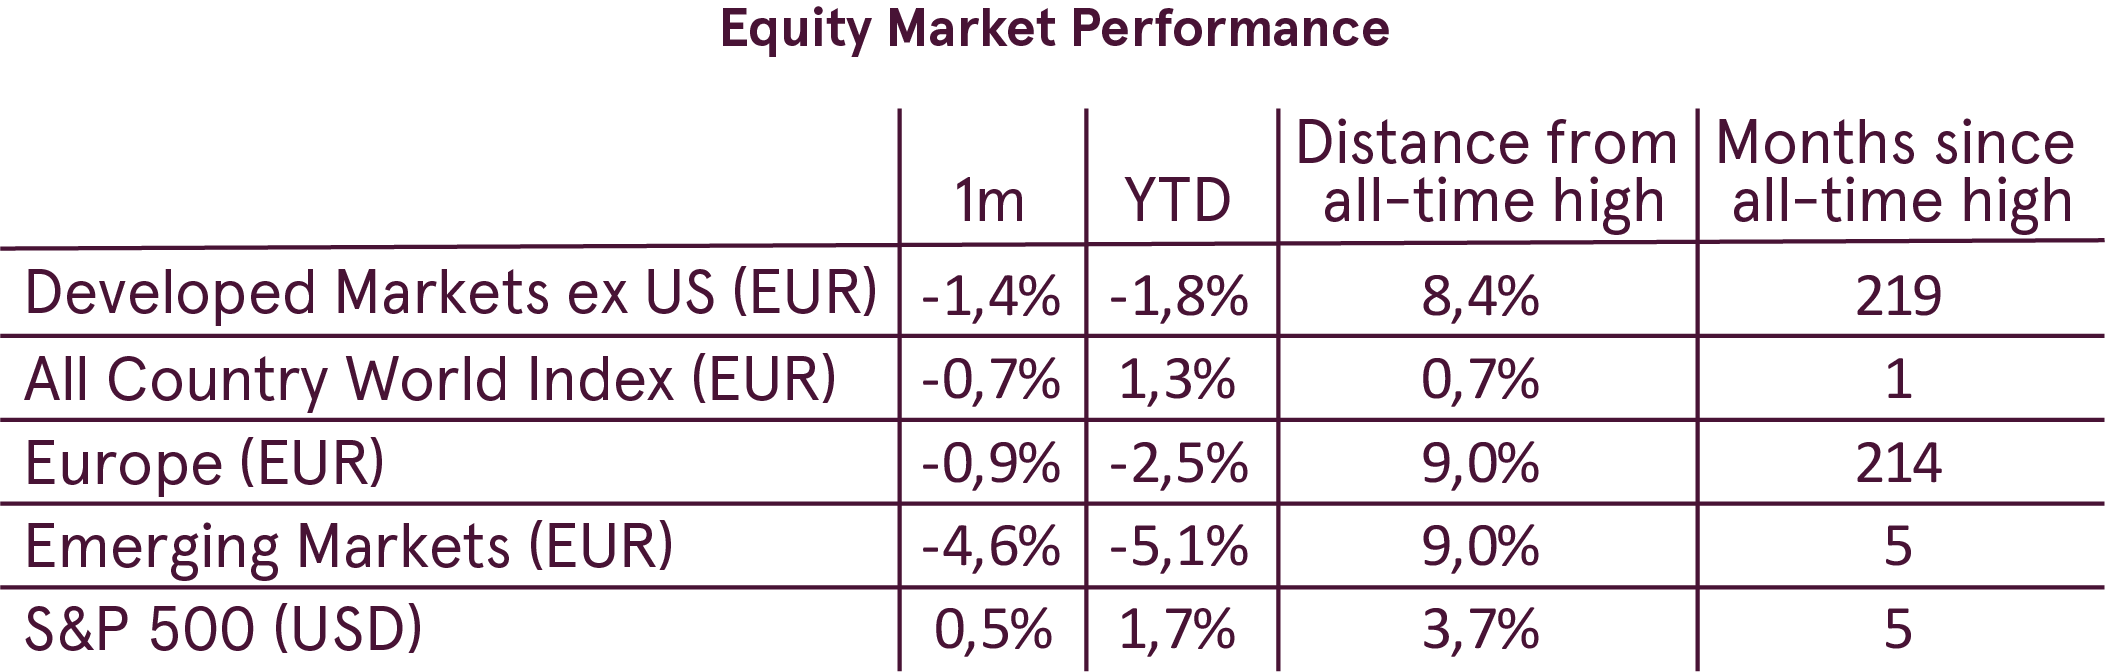
Most of the major equity markets posted a small decline for the month of June. The All Country World Index, representing both developed and emerging market equities, was down 0.73% last month. The only major region that showed stock market gains in June was North America, driven by a 0.55% rise in US equities.
The biggest downward pressure came from the emerging markets, where equities plunged 4.6% in June. A significant part of the decline is explained by the drop in emerging market currencies, which depreciated by 2.7% in June, as measured by the MSCI EM Currency index. However, equities themselves also experienced selling pressure.
Taking a longer term perspective, the All Country World Index is currently less than 1% below the all-time high that was reached last month and is up 1.28% YTD. The US stock market is also up close to 2% this year, which drove the North American region as a whole to a new all-time high in June (measured in EUR).
Bond yields did not see any big moves either in the EU or US, despite the fact that the central banks held their meetings last month. Two-year yields in the EU were basically unchanged for the month, while the US 2-year yield rose 10 basis points in the aftermath of the rate hike by the Fed. Ten-year yields remained flat in June in both US and EU.
Trade war escalates, hurting investor sentiment, but there is still a chance for reasonable resolution
Trade war topics were frequently the main driver of investor sentiment and global markets in June. Reciprocal threats of new tariffs and potential threats of retaliation between the US and the rest of the world have escalated recently. The previously announced tariffs are now being implemented, while threats from new ones are also increasing.
Analysts have estimated that in the worst case, if all threats materialise, we could see tariffs on USD 800 billion of US imports. This would also imply a similar amount of retaliatory tariffs on US exports. Although the worst case scenario is very unlikely to materialise, even this amount is still small compared to total world export volumes, which exceeded USD 17 trillion in 2017 according to WTO statistics.
Obviously, if introduced, such tariffs would negatively impact the global economy. Although their exact impact is impossible to estimate now, the general consensus is that the proposed tariffs will not be able to kill global economic growth.
The most important issue now, however, is not the potential economic impact but growing uncertainty. No one is sure when and how all this will end, making investors nervous about the potential worst case scenarios and thus hurting investor sentiment.
There is one factor, however, which is not often considered by investors that could significantly influence developments – the approaching US midterm elections on 6 November 2018. The domestic economy and stock market are the most important factors used by the US electorate to evaluate political parties. This means that a prolonged correction in US equities will not be favourable to Trump before the elections. Therefore, there is still a good chance that his aggressive rhetoric may cool during the summer. If this happens, it may be a perfect catalyst for the continuation of the uptrend in global equities, as many are currently preparing for the worst.
Bearish sentiment posted the seventh largest weekly increase in the last five years
The effect of the uncertainties described above was very clearly seen in the latest investor sentiment survey by the American Association of Individual Investors (AAII), released on 28 June. Bullish sentiment dropped more than 10 percentage points to 28.4% in the largest weekly drop since early March. Bearish sentiment, on the other hand, surged to 40.8%, the seventh highest percentage in the last five years.
Those developments drove the bull/bear spread (bullish minus bearish sentiment) down by 24.9 points, the fourth largest swing in bearishness of the last five years. Such extreme moves are usually a contrarian indicator and thus investor sentiment should be supportive for equities going forward.
Several regions actually experienced bear market declines in the period from 2009-2018
A lot of investor attention is being paid to the length of the current uptrend in global equities, as more than 9 years has passed since the last financial crisis lows. This makes it the second longest bull market in US history. However, what many people miss is that some of the major regions’ equities have officially experienced a bear market during this period.
A widely accepted definition of the bear market is a decline of 20% or more. For example, emerging market equities were in a bear market twice during that period, in 2011 and 2015-2016. European equities were also in a bear market during 2011, while developed markets (excluding US) were very close to that, dropping over 19% in 2011. However, due to the strong performance of US equities, those bear markets went unnoticed.
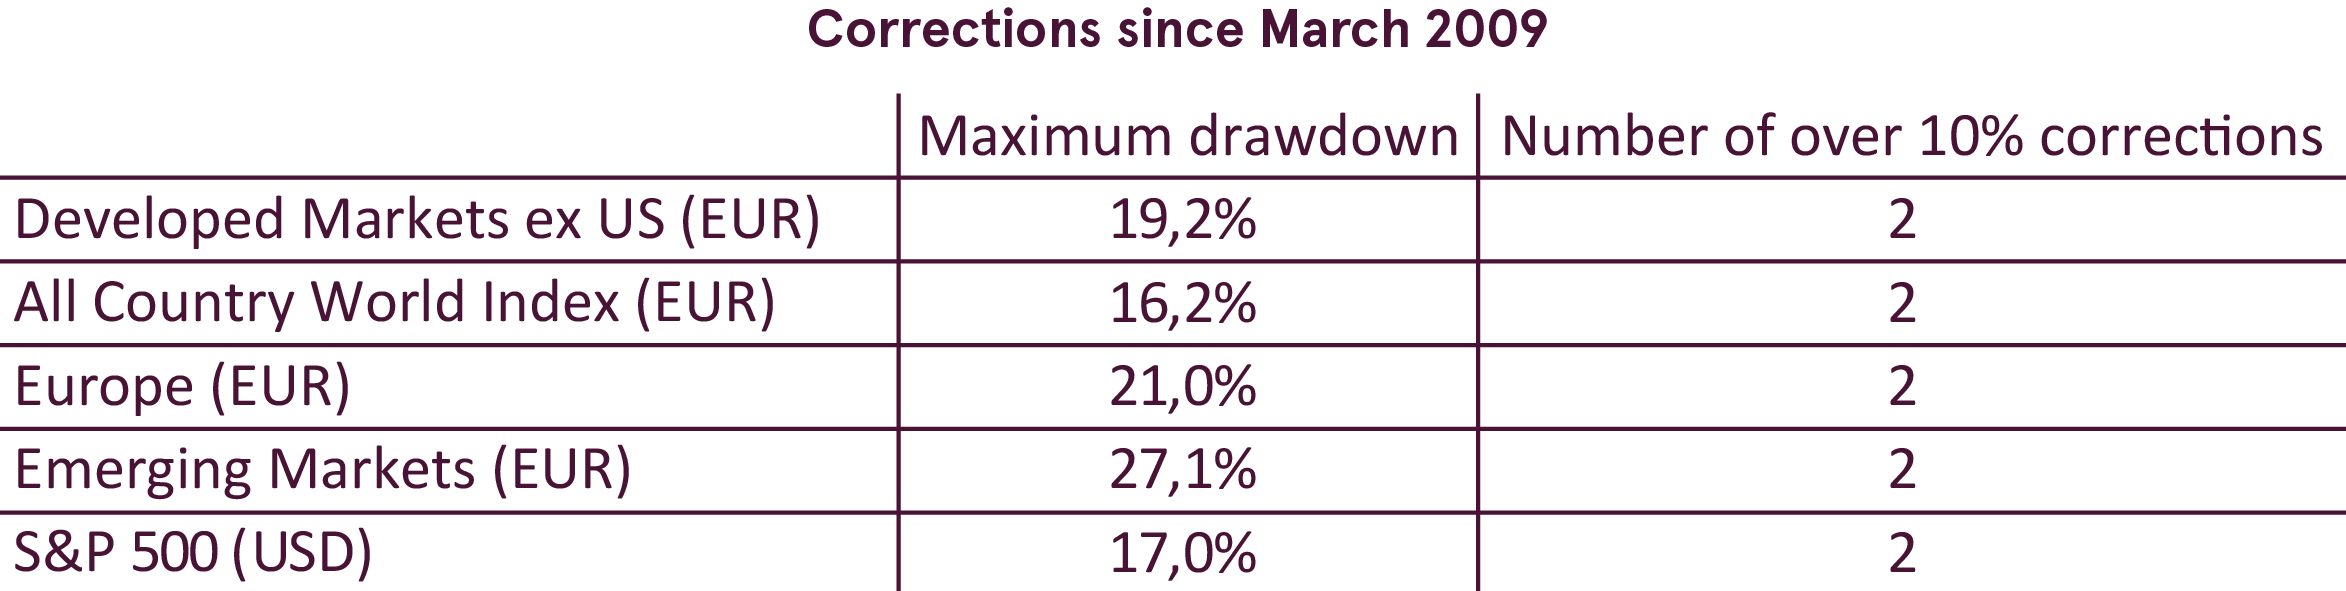
What this implies is that the uptrend in equities is not actually as stretched as many might believe. Recent memories of the financial crisis induce investors to expect drops of similar magnitude much more often than they actually happen. Equity markets have experienced several healthy corrections and the length of time since the last financial crisis alone should not be a limitation on a potential upside.
Investors are fleeing emerging markets, but is the fear justified?
After reaching a new all-time high at the start of the year, emerging market equities have been under pressure ever since. The selling pressure intensified in June, driving the emerging market equity index to a 5% loss for the year and 9% below all-time highs. More than half of this decline is explained by the drop of emerging market currencies, which are down 3% for the year. However, investors were also selling stock, as during May retail investors took USD 12 billion out of emerging market equity funds.
The main driver behind the latest decline is fear of the new emerging market funding crisis. Some investors fear that the rise in USD rates and depreciation of emerging market currencies will result in the inability of the emerging market countries to refinance their debt. What those people miss, however, is that emerging market counties became much wealthier and have bigger FX reserves now than 20 years ago.
According to Research Affiliates analysis, the countries that may have an elevated risk of a funding crisis and are thus making the news headlines actually constitute just less than 20% of total emerging markets, while the largest part, representing 60% of the total, has barely any risk at all.
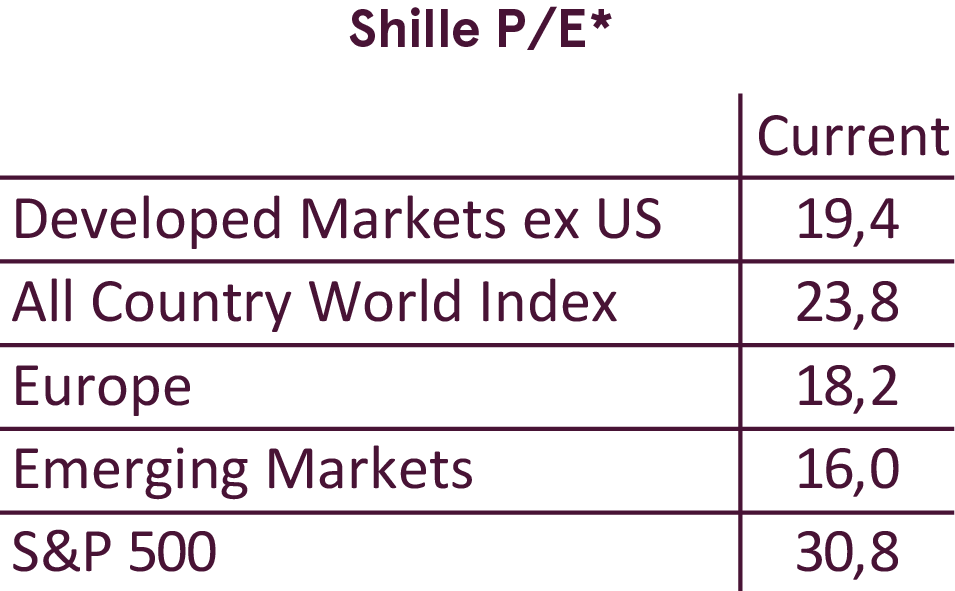
Finally, if we take into account the emerging market equity valuation, they are currently priced at less than half of the US CAPE (Cyclically adjusted Price to Earnings). This implies that emerging market equities seem to provide a fair compensation for the risks. As a result, we favour emerging market equities and China in particular, considering all the factors above.
Outlook
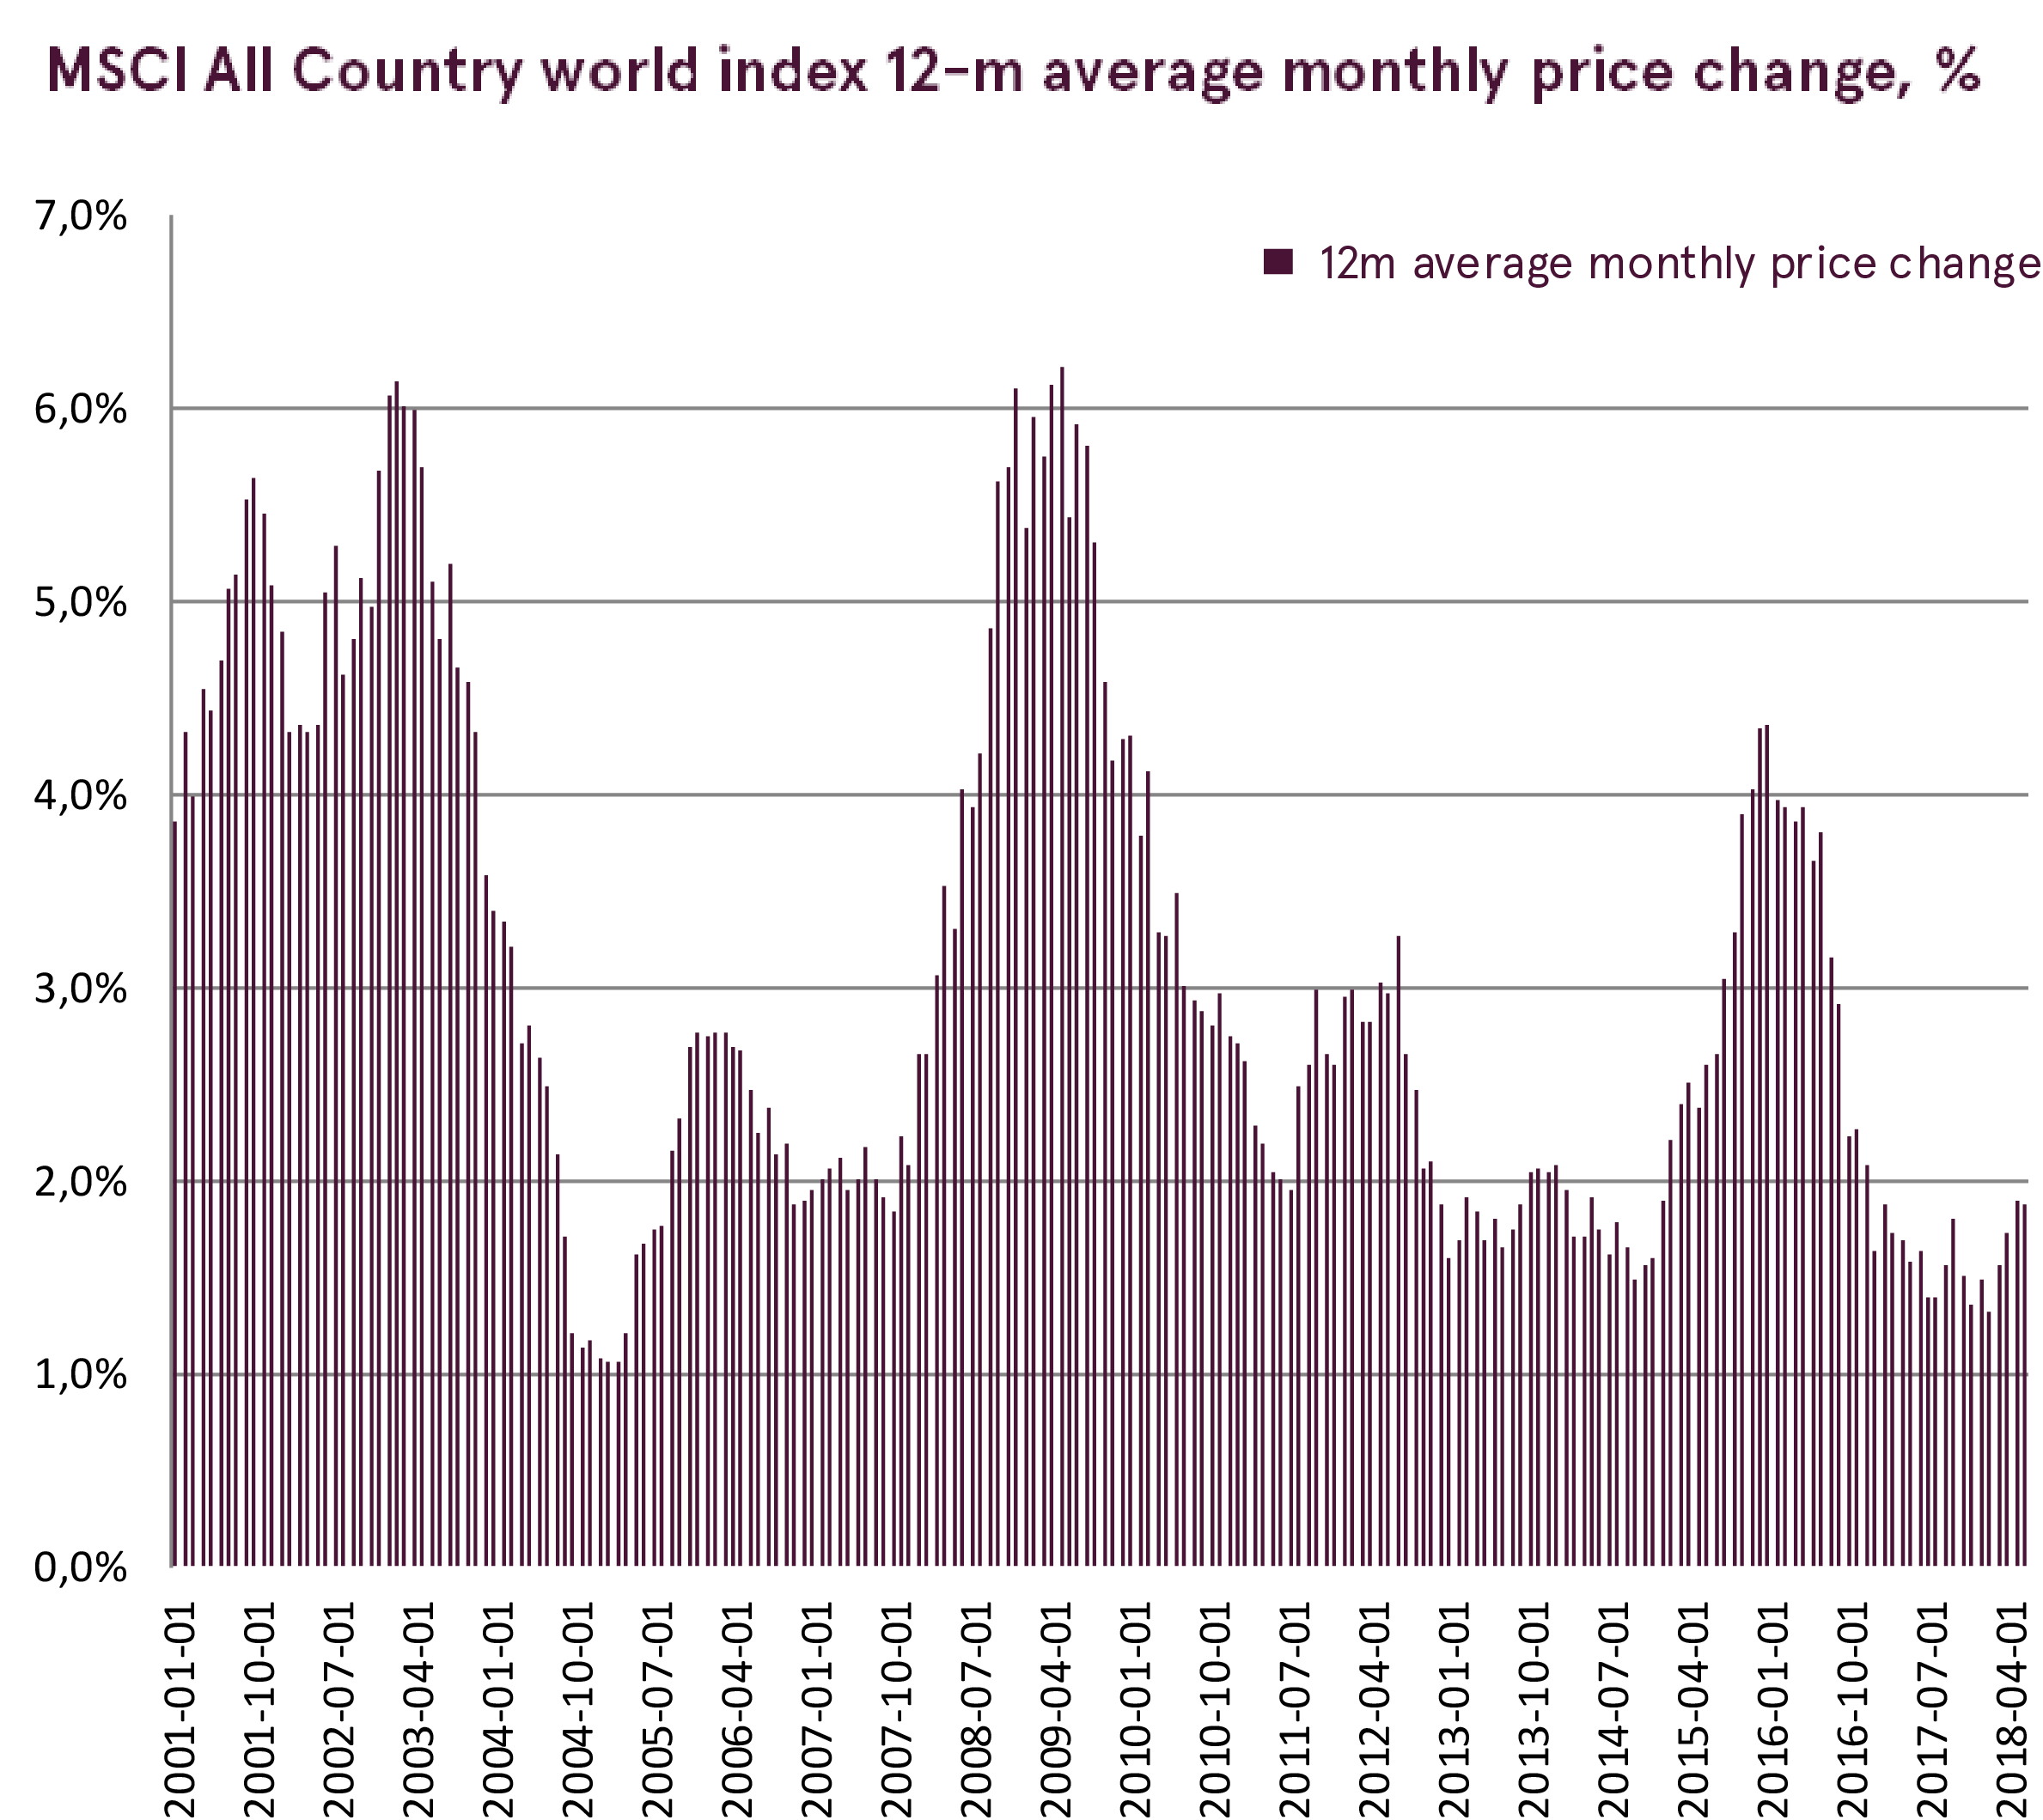
Although many uncertainties make us more cautious, we still do not see clear signs of the end of the bull market. Volatility should clearly stay elevated as events unfold, but current levels of volatility are still below historical averages. The average monthly change for the MSCI All Country World Index is slightly over 3%, while the average monthly move this year in the index was just 2.3%.
Moreover, earnings growth is expected to continue strongly in Q2 2018. Earnings in the US are expected to grow 20.7% in Q2. The growth in European earnings, aided by the weaker euro, is also expected to increase in Q2 to 8.7%. As a result, earnings growth, as the main driving factor for global equities, remains in place and should provide support going forward.
Warnings
- This Marketing Communication is not considered investment research and has not been prepared in accordance with standards applicable to independent investment research.
- This Marketing Communication does not limit or prohibit the bank or any of its employees from dealing prior to its dissemination.
Origin of the Marketing Communication
This Marketing Communication originates from the Portfolio Management unit (hereinafter referred to as PMU) – a division of Luminor Bank AS (reg. No 11315936, with registered address at Liivalaia 45, 10145, Tallinn, Republic of Estonia, represented within the Republic of Latvia by Luminor Bank AS Latvian branch, reg. No 40203154352, address: Skanstes iela 12, LV-1013, Riga, hereinafter - Luminor). PMU is involved in the provision of discretionary portfolio management services to Luminor clients.
Supervisory authority
As a credit institution Luminor is subject to supervision by the Latvian Financial Supervisory Authority (Finanšu un kapitāla tirgus komisija). Additionally, Luminor is subject to supervision by the European Central Bank (ECB), which undertakes such supervision within the Single Supervisory Mechanism (SSM), which consists of the ECB and the national responsible authorities (Council Regulation (EU) No 1024/2013 - SSM Regulation). Unless set out herein explicitly otherwise, references to legal norms refer to norms enacted by the Republic of Latvia.
Content and source of the publication
This Marketing Communication has been prepared by PMU for information purposes. Luminor will not consider recipients of this Communication as its clients and accepts no liability for use by them of the contents, which may not be suitable for their personal use.
Opinions of PMU may deviate from recommendations or opinions presented by the Luminor Markets unit. The reason may typically be the result of differing investment horizons, using specific methodologies, taking into consideration personal circumstances, applying a specific risk assessment, portfolio considerations or other factors. Opinions, price targets and calculations are based on one or more methods of valuation, for instance cash flow analysis, use of multiples, behavioural technical analyses of underlying market movements in combination with considerations of the market situation, interest rate forecasts, currency forecasts and investment horizon.
Luminor uses public sources that it believes to be reliable. However, Luminor has not performed independent verification. Luminor makes no guarantee, representation or warranty as to their accuracy or completeness. All investments entail a risk and may result in both profits and losses.
This Marketing Communication constitutes neither a solicitation of an offer nor a prospectus in the sense of applicable laws. An investment decision in respect of a financial instrument, a financial product or an investment (all hereinafter “product”) must be made on the basis of an approved, published prospectus or the complete documentation for such a product in question, and not on the basis of this document. Neither this document nor any of its components shall form the basis for any kind of contract or commitment whatsoever. This document is not a substitute for the necessary advice on the purchase or sale of a financial instrument, a financial product.
No Advice
This Marketing Communication has been prepared by Luminor PMU as general information and shall not be construed as the sole basis for an investment decision. It is not intended as a personal recommendation of particular financial instruments or strategies. Luminor accepts no liability for the use of the Marketing Communication content by its recipients.
If this Marketing Communication contains recommendations, those recommendations shall not be considered as an objective or independent explanation of the matters discussed herein. This document does not constitute personal investment advice or take into account the individual financial circumstances or objectives of the persons who receive it. The securities or other financial instruments discussed herein may not be suitable for all investors. The investor bears all risk of loss in connection with an investment. Luminor recommends that investors independently evaluate each issuer, security or instrument discussed herein and consult any independent advisors if they believe it necessary.
The information contained in this document also does not constitute advice on the tax consequences of making any particular investment decision. The estimates of costs and charges related to specific investment products are not provided therein. Each investor shall make his/her own appraisal of the tax and other financial advantages and disadvantages of his/her investment.
Risk information
The risk of investing in certain financial instruments including those mentioned in this document, is generally high, as their market value is exposed to many different factors. The value of and income from any investment may fluctuate from day to day as a result of changes in relevant economic markets (including changes in market liquidity). The information herein is not intended to predict actual results, which may differ substantially from those reflected. Past performance is not necessarily indicative of future results. When investing in individual financial instruments the investor may lose all or part of their investments.
Important disclosures of risks regarding investment products and investment services are available here.
Conflicts of interest
To avoid occurrence of potential conflicts of interest as well as to manage personal account dealing and / or insider trading, the employees of Luminor are subject to internal rules on sound ethical conduct, management of inside information, handling of unpublished research material and personal account dealing. The internal rules have been prepared in accordance with applicable legislation and relevant industry standards. Luminor’s Remuneration Policy establishes no link between revenues from capital markets activity and remuneration of individual employees.
The availability of this Marketing Communication is not associated with the amount of executed transactions or volume thereof.
This material has been prepared following the Luminor Conflict of Interest Policy, which may be viewed here.
Distribution
This Marketing Communication may not be transmitted to, or distributed within, the United States of America or Canada or their respective territories or possessions, nor may it be distributed to any U.S. person or any person resident in Canada. The document may not be duplicated, reproduced and(or) distributed without Luminor’s prior written consent.