A new downtrend or just a correction?
  • Second correction in 2018 brings global equity investors back to start of year
  • Current correction in equity prices drives ACWI below 200-day moving average. Uptrend broken?
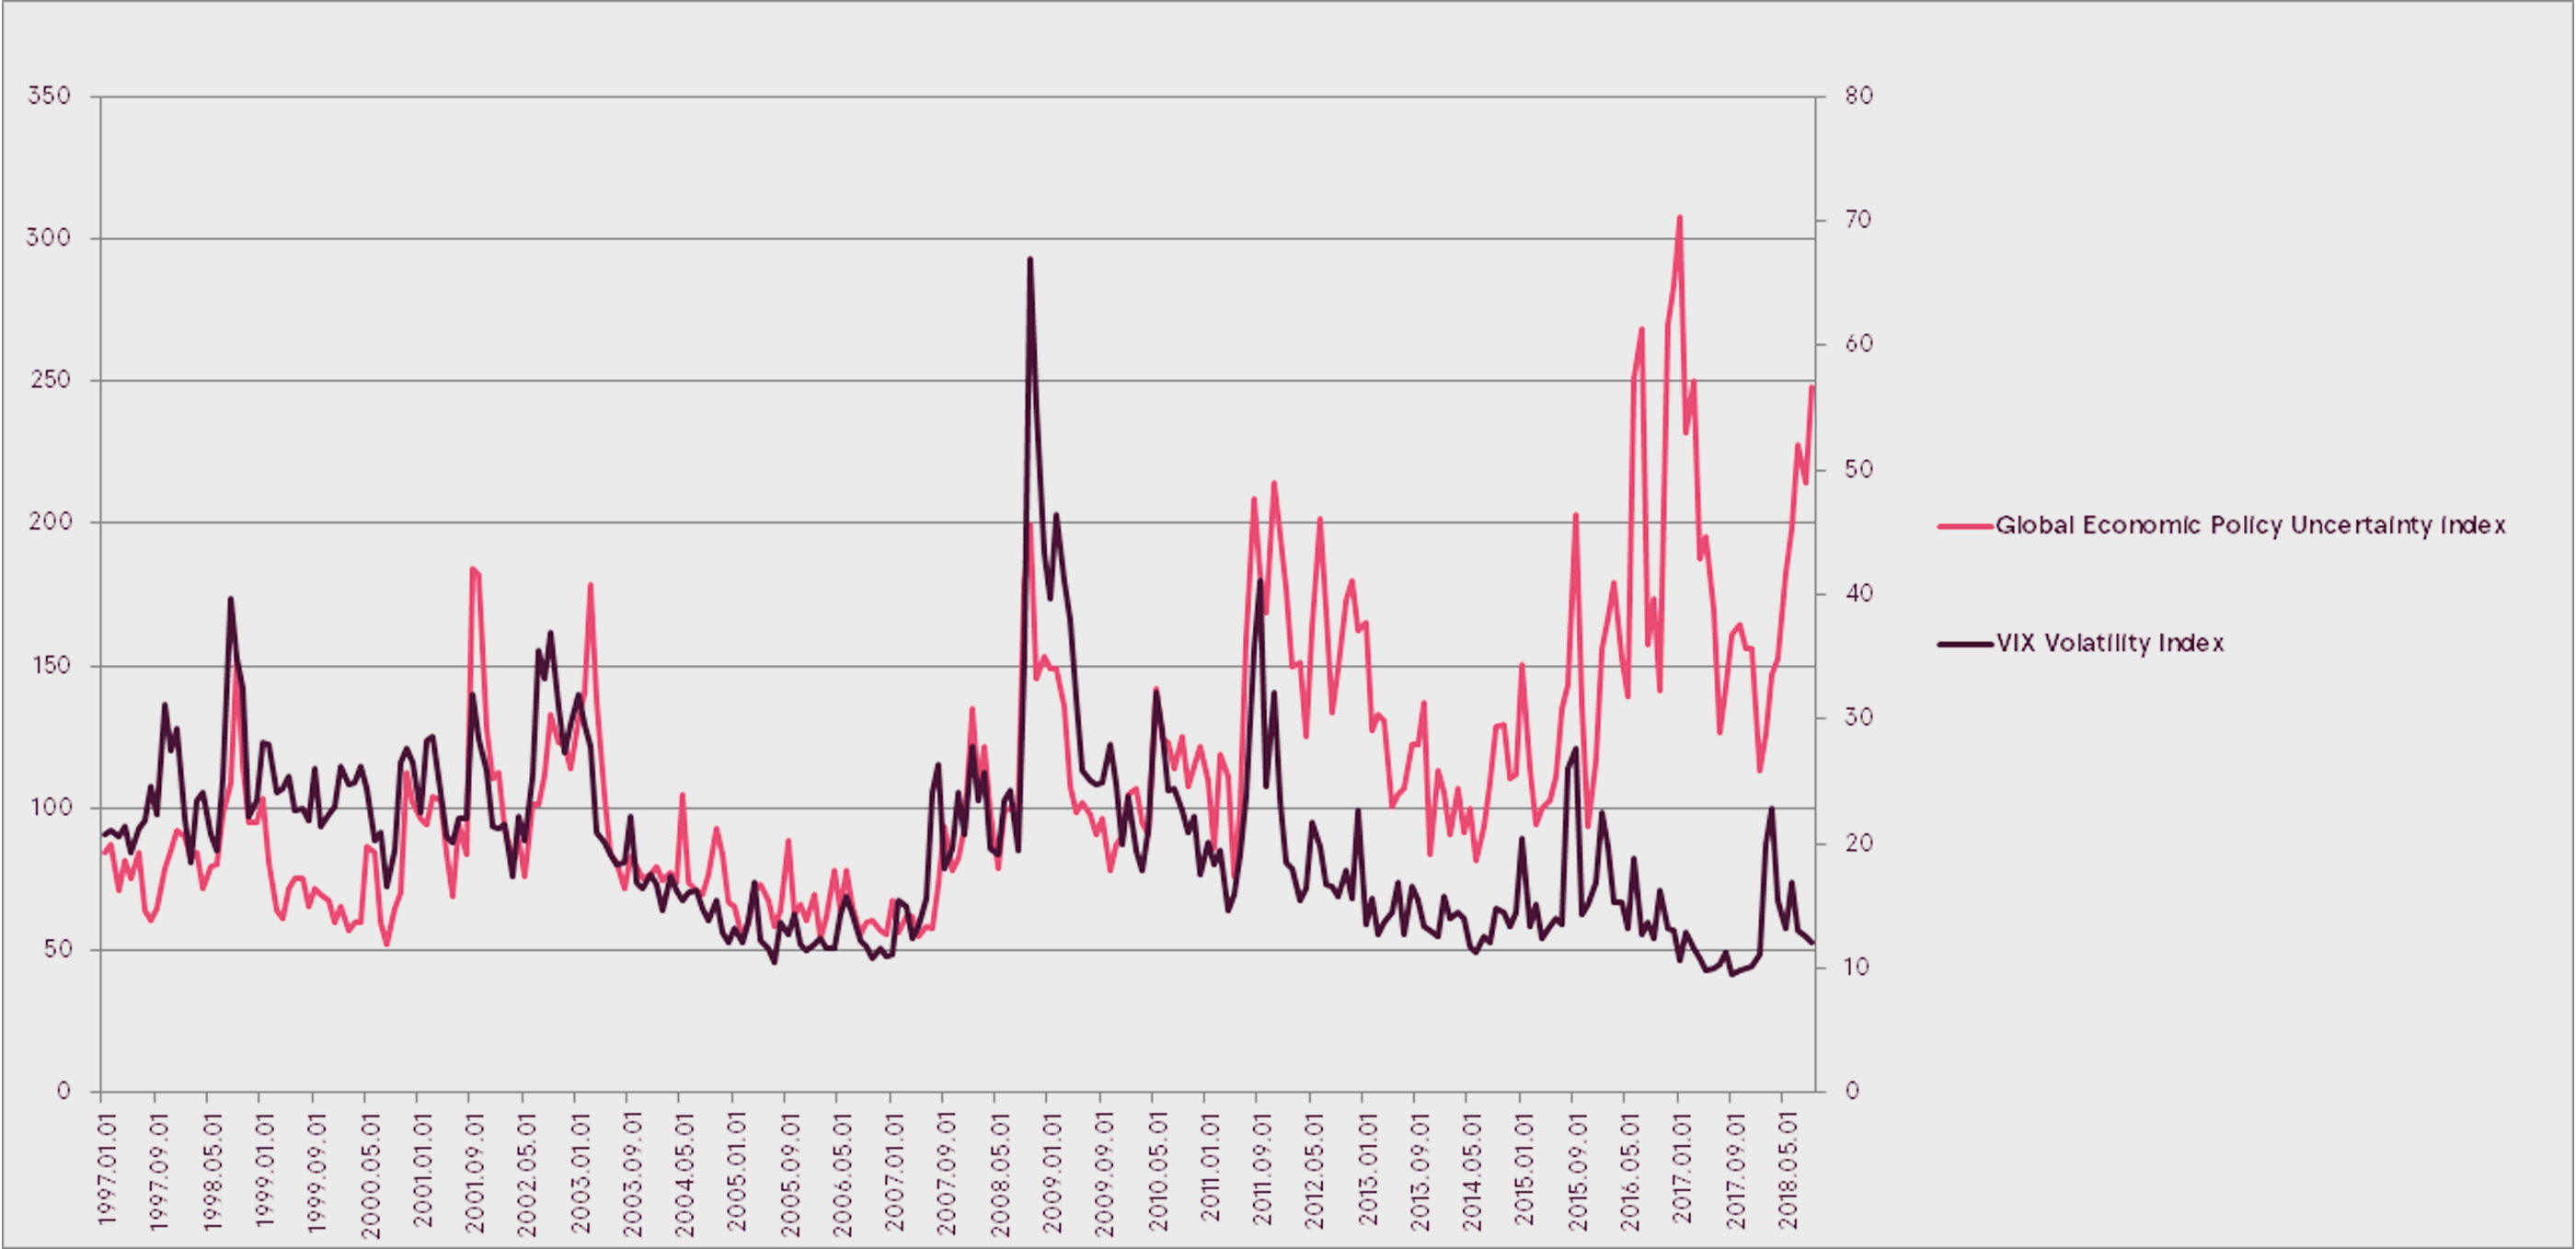
  • Increased economic policy uncertainty predicts increase in equity volatility
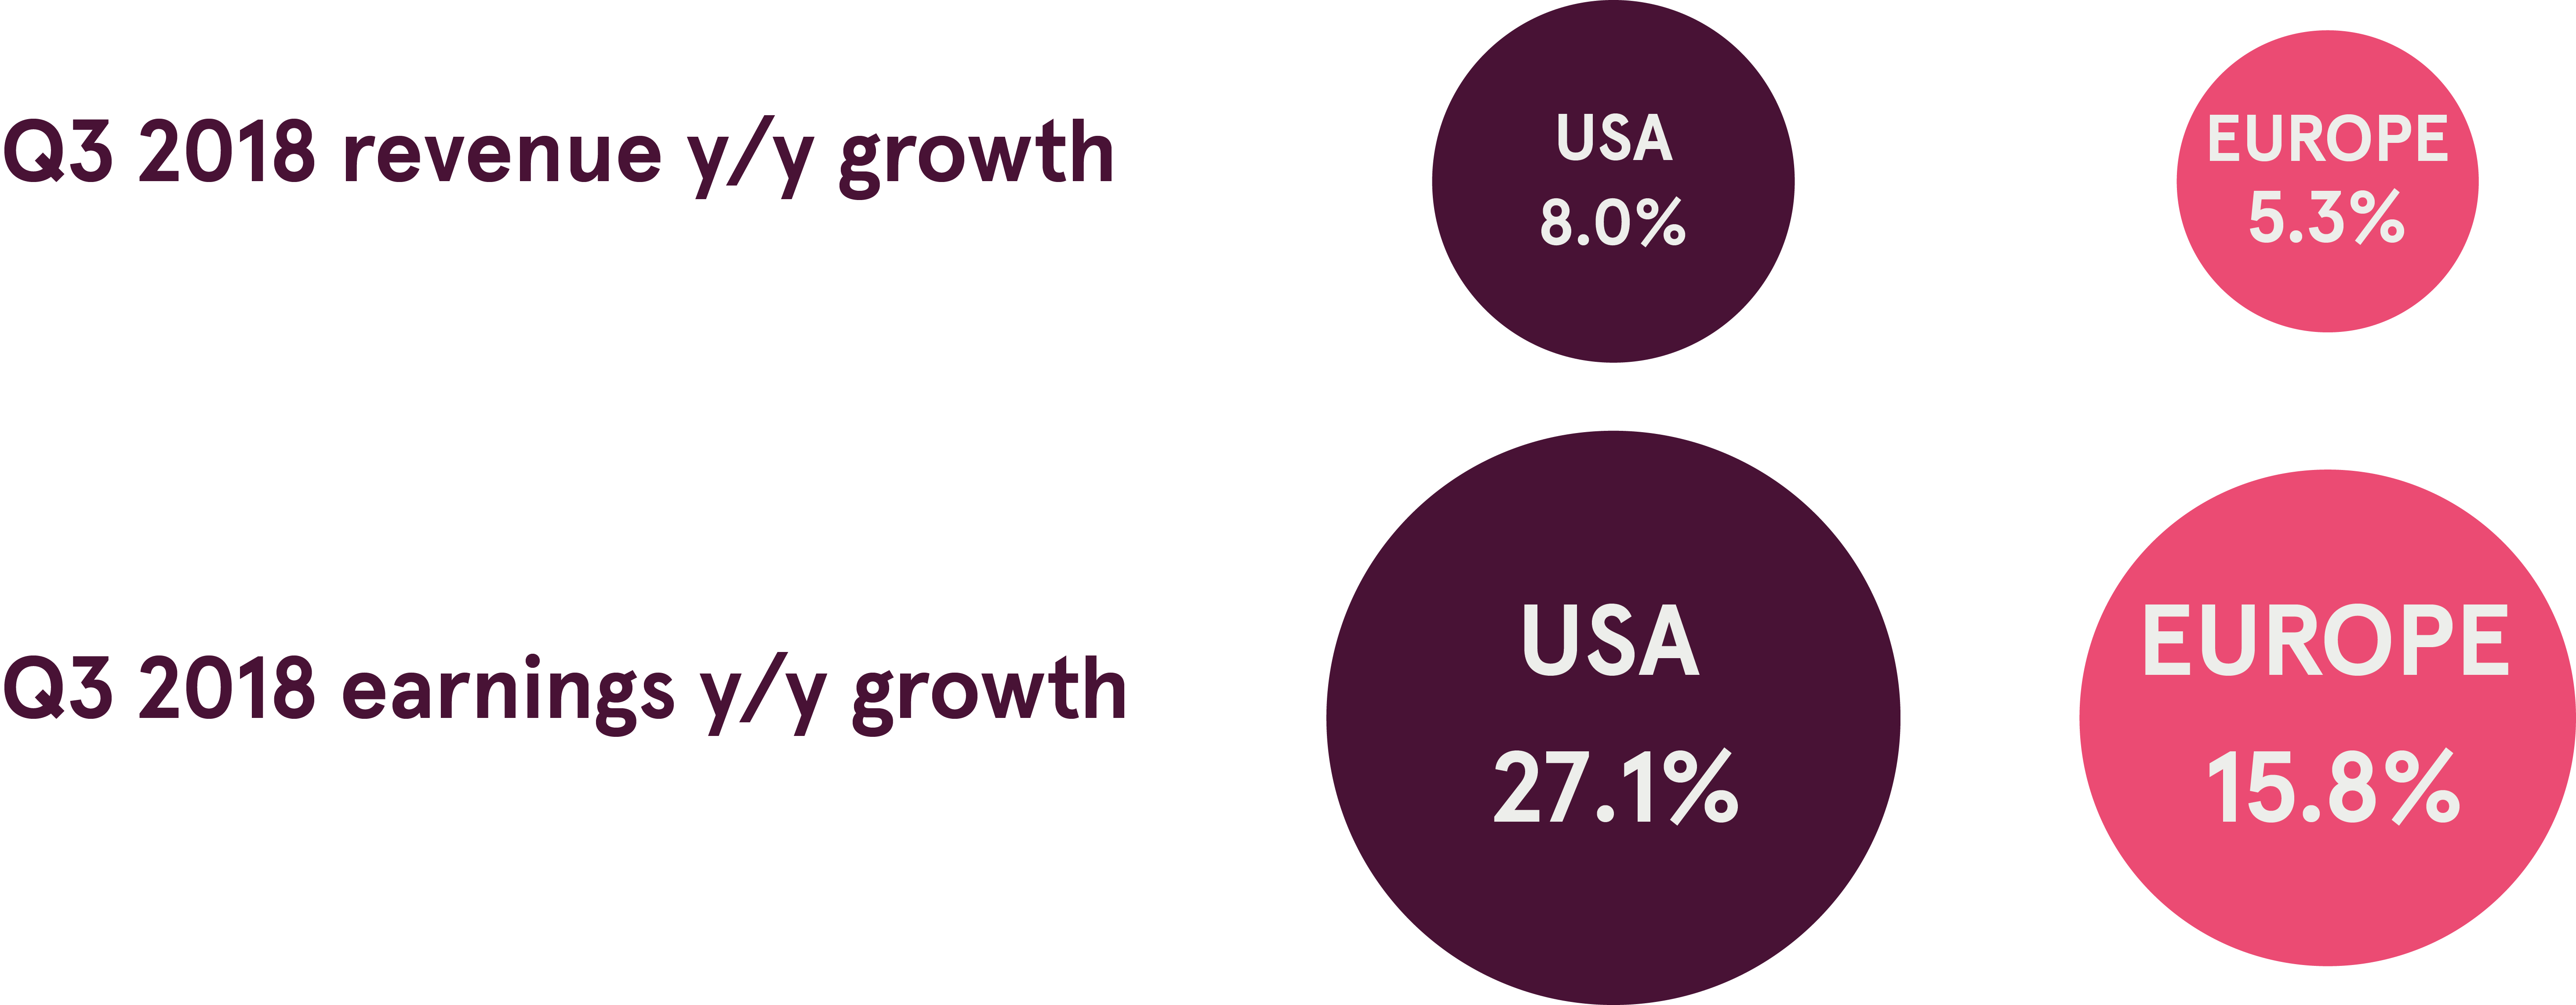
  • 77% of US companies report better than expected earnings and more than 60% beat revenue expectations
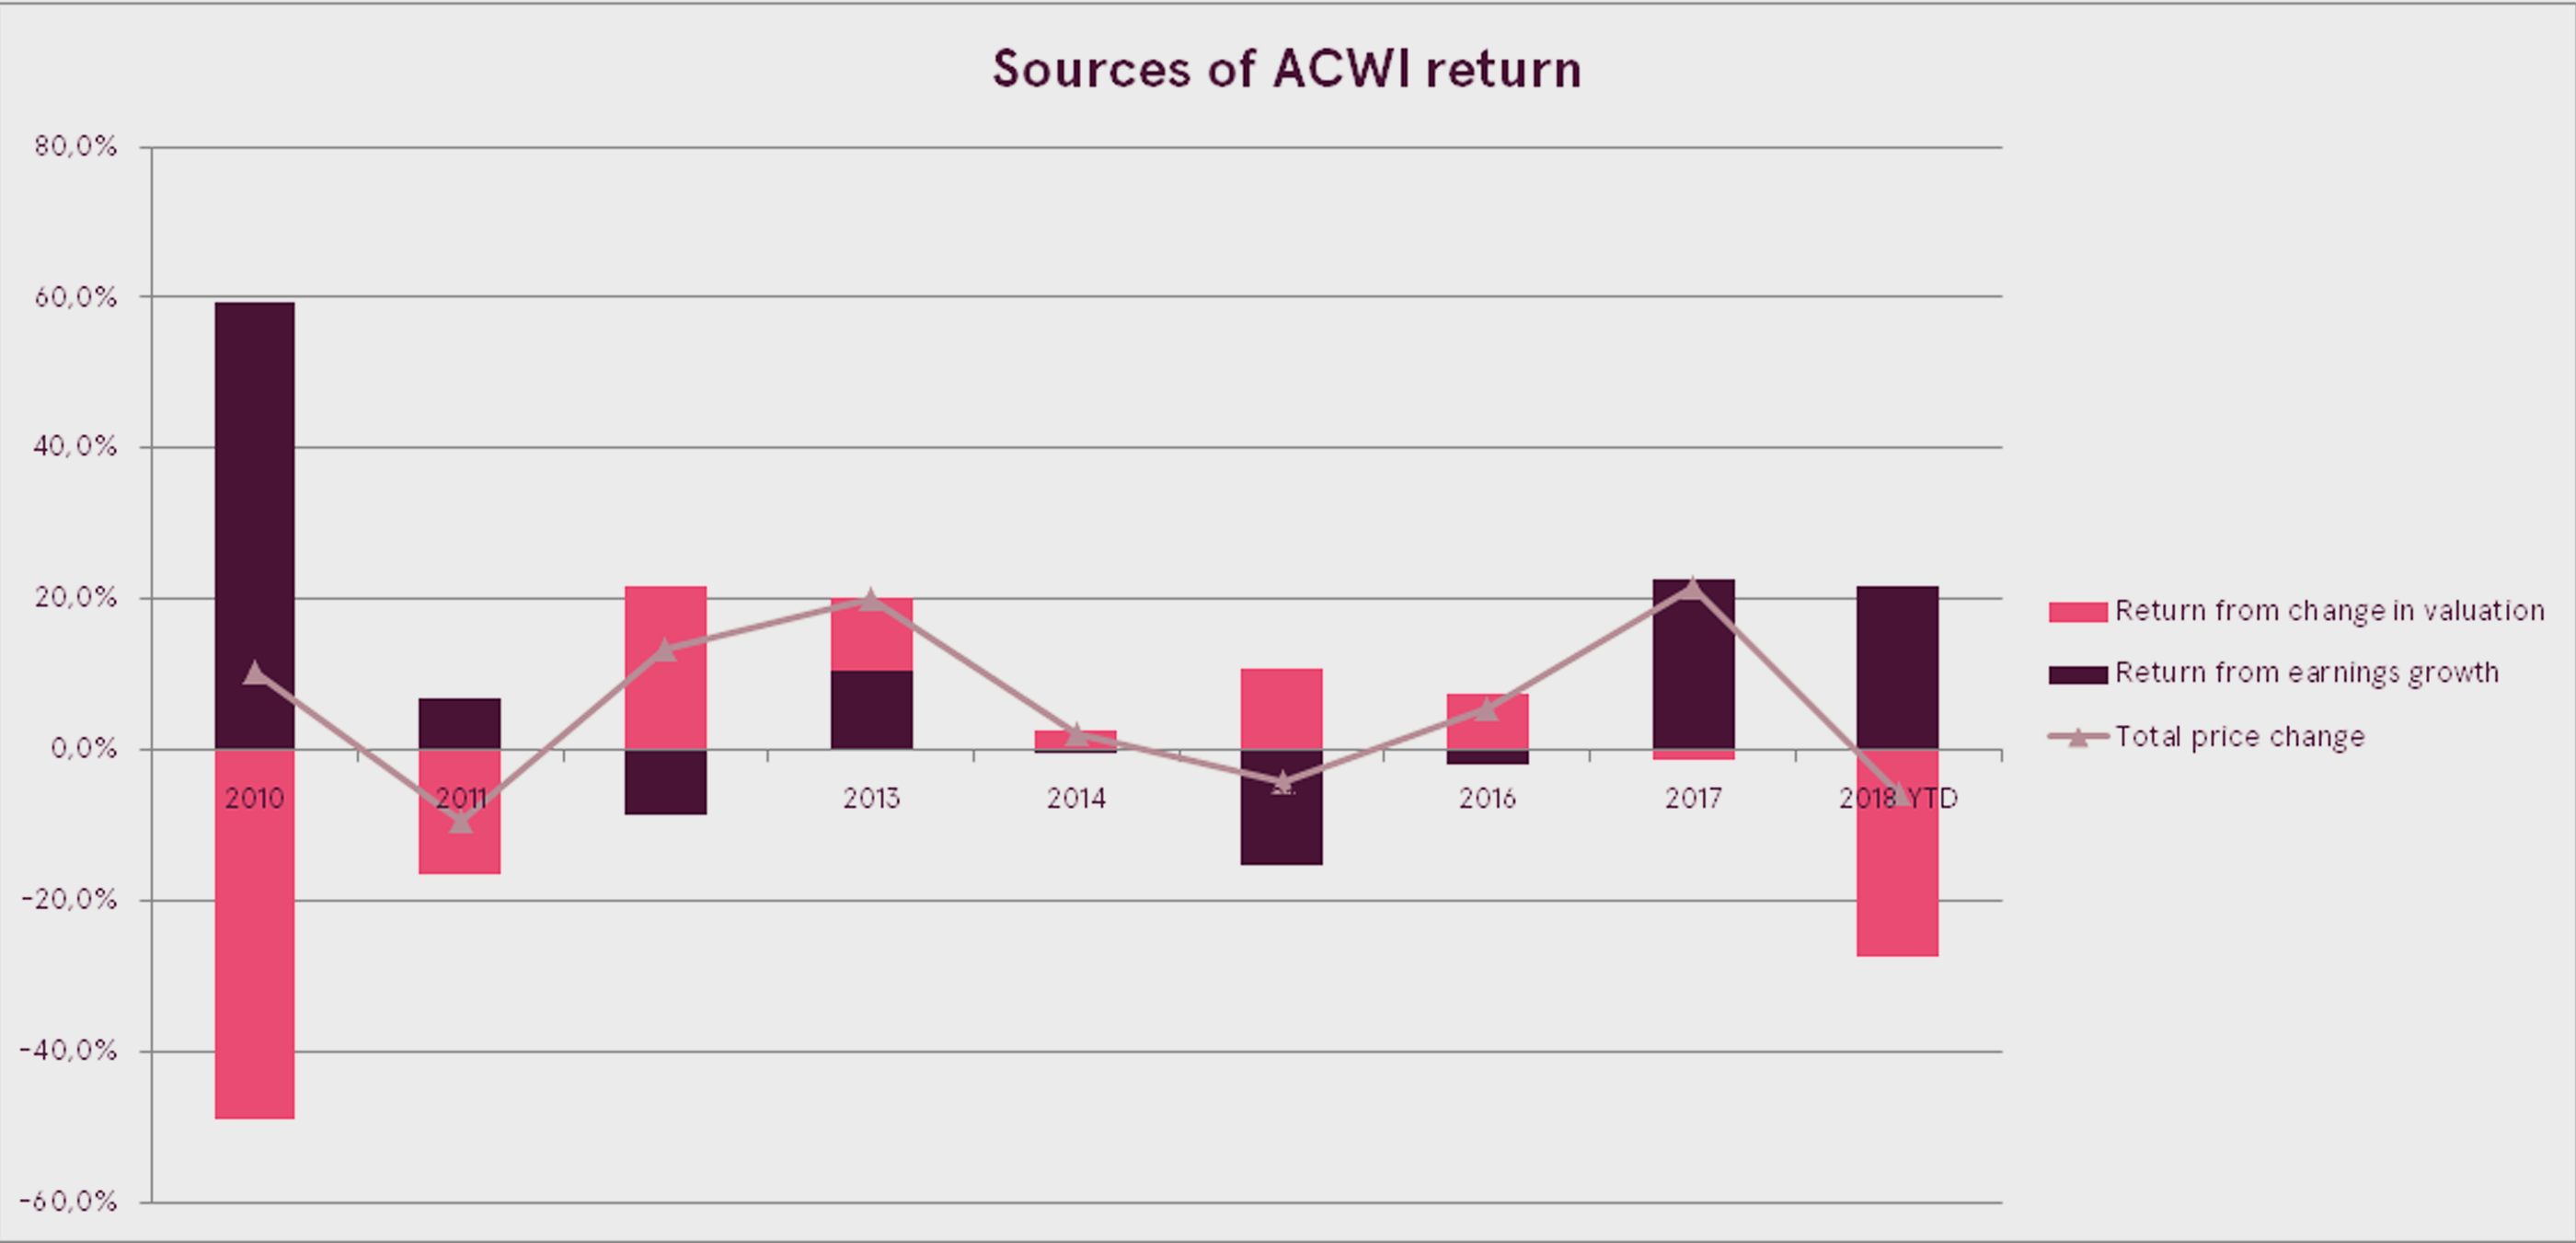
  • All price gains in ACWI since start of 2017 fuelled by earnings growth

Second correction in 2018 brings global equity investors back to the start of the year

The global financial markets were marked by volatility in October as world equities began to correct after reaching new all-time highs the month before. Selling pressure, which started in the second week of October, accelerated towards the end of the month and the market was unable to rebound until the last two days of the month.

The ongoing correction is already the second this year and has pushed global equity prices to the levels seen at the start of the year. After a 5.3% slide in October, the All County World index has managed to maintain a tiny gain of 0.1% so far in 2018. If the price decline continues, 2018 may become the first year since 2011 in which world equities show negative performance. It is worth noting, however, that the ACWI is just over 5% below its record level.

The rise in interest rates in the middle of the month and the stronger USD have further damaged investor sentiment towards emerging-market equities. As a result, the emerging market equity index plunged 6.5% in October and is down over 12% this year.

US equities also suffered a significant decline, but the drop was slightly balanced by the appreciation of the USD. Nevertheless, the S&P 500 index was up 1.4% for the year at the end of October.

Did the correction break the up-trend?

As global equity prices continued their correction, investors wondered whether the longer-term uptrend had been broken. A widely used and followed indicator of the-long term trend is the 200-day moving average of the index price. If the current price is above the 200-day moving average, the index is considered to be uptrending, and if below then downtrending. The crossing of the current price above or below the moving average is considered to be an indication of the change in the trend.

Current correction in equity prices drove the ACWI below its 200-day moving average. However, this is not enough for us to conclude that the trend has changed. Looking at historical data for the ACWI, since 2000 the index has crossed its 200-day moving average 121 times. However, 81 of those times (67%) the signal turned out to be false and the trend did not reverse. Consequently, although crossing the 200-day moving average may help identify a change in the trend, the high percentage of false signals renders it an unreliable indicator.

Economic policy uncertainty causes equity market volatility

Financial markets do not like uncertainty of any kind, as it makes investors anxious and future projections harder to make. As a result, it becomes hard for investors to make rational decisions and the markets start to overreact to news and events, increasing volatility. And it is obvious that investors should be most sensitive to uncertainty in economic policy.

To measure the level of uncertainty in global economic policy, a Global Economic Policy Uncertainty index was launched (Davis, Steven J., 2016. “An Index of Global Economic Policy Uncertainty,” Macroeconomic Review, October). The index evaluates media articles on economic policy topics. The higher the value, the greater the uncertainty.

Looking at the graph above it is evident that the Global Economic Uncertainty index historically moved quite closely with the level of US equity market volatility.

As such, looking for explanations for the current market decline, increased economic policy uncertainty seems a good match. Trade war issues between the US and China, the US mid-term elections, a possible interest rate spike, the Italian debt crisis and the looming Brexit deadline have all contributed to increased uncertainty. Higher volatility did not follow immediately, but the building pressure had to dissipate sooner or later, which it did in October.

Strong earnings should help restore investor sentiment

Investor sentiment suffered severely in October in the aftermath of the turmoil on the markets. Flows to bearish bets have increased significantly and have reached extreme levels. Such an extreme level of negative sentiment is usually a contrarian indicator and would suggest that prices may rebound in the short term.
The ongoing Q3 earnings reporting season may be the catalyst that is needed to restore investor sentiment.  In the US over 77% of companies are reporting better than expected earnings and over 60% are beating revenue expectations. US corporate earnings are expected to grow by an astonishing 27.1% compared to last year.

In Europe the picture is more modest, with around 50% of companies reporting better than expected earnings. Nevertheless, European corporate earnings are expected to grow by 15.8% compared to last year.
Globally, one-year earnings growth for ACWI is currently at 18.7%. More importantly, for next year the estimated earnings growth is over 10%.

Since the start of 2017 all price gains in the ACWI have been fuelled purely by earnings growth

There are two sources of the equity price change: earnings growth and change in valuation (or how much investors are willing to pay per unit of earnings). When the equity uptrend is mostly caused by an increase in the P/E multiple, equities become more expensive. Such a trend is not sustainable. Since 2017, however, all price increases in the ACWI have been driven by growth in corporate earnings. Moreover, the P/E multiple has decreased by over 20%, making global equities cheaper.

As a result, global equities are now cheaper than they were in 2016, at the same as earnings are expected to show double-digit growth next year.

Outlook

Uncertainty and risks have increased of late, hurting investor sentiment. Nevertheless, the overall picture continues to be strong. Some expected moderation in global economic growth should actually provide relief, as inflation should thus remain contained and central banks less inclined to raise rates.

Therefore, October’s turmoil looks like a normal correction, while the longer-term uptrend remains intact. Moreover, the risks are fairly balanced by potential positive developments. Should there be meaningful progress in the trade negotiations between the USA and China, the market may react very positively to the news.

DISCLAIMER

The present marketing material (Overview) was prepared by Luminor Bank AS (Luminor) analysts based on publicly available information at the time of preparation and relying on their professional evaluation.
Subject to changes in circumstances, the opinions given in the Overview may differ from current ones, which is why Luminor bears no responsibility for the timeliness of the opinions presented in the Overview.
This Overview should not be deemed an investment consultation or an offer to invest in financial instruments, make financial transactions or act in any other way. The Overview may not be interpreted as Luminor’s confirmation or promise of occurrence of the events reported in the Overview. The data presented is not connected to any potential information receiver’s specific investment goal, financial situation nor any specific needs.
The historical yield of securities described in this Overview is for reference only. The historical yield may not be considered as a guarantee for future investment results, as the real yield may differ considerably from the one referred to herein.
Luminor shall not be held liable for any loss that the customer might incur due to relying on information contained herein. Before making any investment or credit decision it is recommended to use the help of a respected professional and evaluate the suitability of the investment product or service to the customer’s risk profile and goals.
The terms and conditions of financial instruments and investment fund prospectuses can be found on the Luminor homepage www.luminor.lv. This material may not be copied, distributed or published in any form without Luminor’s prior written consent.